- Analyst said that Bitcoin might reach $48,000 or $51,000 before halving.
- Bitcoin’s volatility tightened, suggesting that notable price fluctuations might be minimal.
- The accumulation of Bitcoin by large entities increased, indicating a possible recovery.
According to Michaël van de Poppe, founder of MN Trading, the price of Bitcoin (BTC) might hit between $48,000 and $51,000 before the next halving. The analyst, in his post, admitted that the coin’s consolidation has made the price action “boring.”
Nevertheless, the analyst’s opinion meant that BTC could jump more than 20% before the event, which is less than 100 days away. Van de Poppe’s opinion could be valid considering Bitcoin’s historical performance.
BTC To Repeat Historical Performance?
For instance, before the July 2016 second halving, Bitcoin’s price climbed from $392 to $604. A similar scenario happened just before the May 2020 halving. During that period, BTC jumped from $7,194 to $9,080.
Therefore, the coin might repeat the trend this year. However, with February already here, the price action has to start moving upward if it is to reach the predicted value.
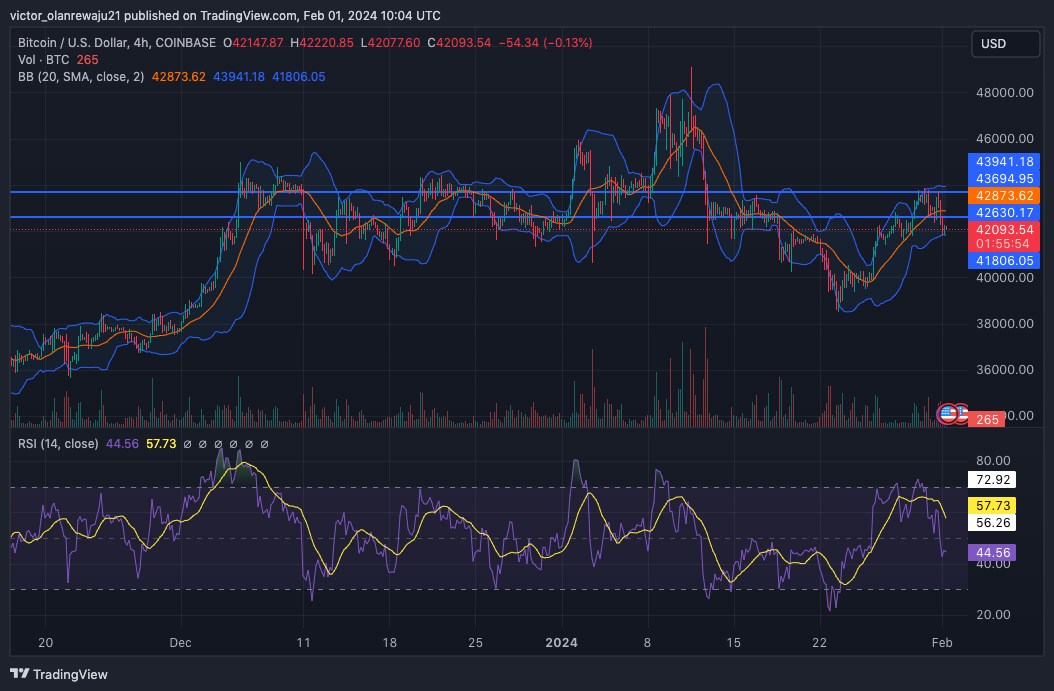
At press time, BTC changed hands at $42,167. This was a 7.96% decrease in the last 30 days. Also, the last 24 hours have not been bullish for the cryptocurrency, as it fell by 1.97%.
According to the 4-hour BTC/USD chart, volatility around the coin has become tight. This was evident in the indications shown by the Bollinger Bands (BB). If the bands do not expand, then BTC’s price fluctuations might be minimal.
However, the lower band of the BB touched the price at $42,121, suggesting that Bitcoin was oversold. As such, the coin price might climb. But if it does, it might not go beyond $42,630 in the next few days.
In a highly bullish scenario, BTC might hit $43.940. At the same time, it could face some resistance there.

Players Continue To Buy the Dip
From the chart above, the Relative Strength Index (RSI) trended downward. This implies weak buying momentum. Should this momentum fail to become bullish, BTC might drop below $42,000.
But if it does, it could be an opportunity to buy the coin at a discount. Meanwhile, in another development, analyst Ali Martinez noted that Bitcoin accumulation has been intense of late.
In his post, Martinez admitted that the accumulation trend score was at one of its highest in the last three years. If this accumulation goes on, BTC’s rise to $48,000 or $51,000 might be possible.
The analyst also noted that many large entities are also buying, indicating rising confidence in the price action. With all of these indicators, Bitcoin seemed to be offering a “buy the dip” chance before it rallies.
Disclaimer: The information presented in this article is for informational and educational purposes only. The article does not constitute financial advice or advice of any kind. Coin Edition is not responsible for any losses incurred as a result of the utilization of content, products, or services mentioned. Readers are advised to exercise caution before taking any action related to the company.


