


- APE market trend remains bearish, with strong resistance at $4.74
- Traders may consider shorting or exiting long positions due to negative momentum.
- Oversold conditions may present buying opportunities, but caution is advised.
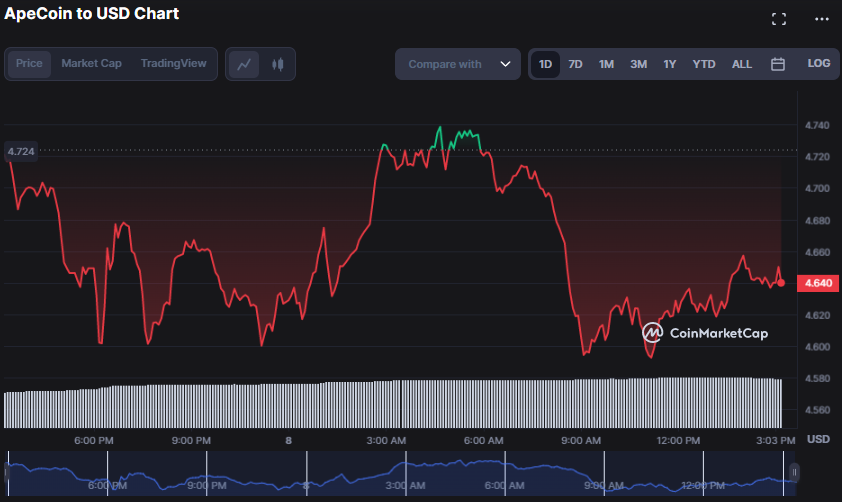
The ApeCoin (APE) market has been bearish in the previous 24 hours, with bullish efforts to correct the market thwarted after encountering solid resistance at the intra-day high of $4.74. This barrier forced the bulls to retrace, allowing negative momentum to take over, lowering the price to a low of $4.58, where support was established.
The negative trend remained intact as of press time, causing the price to fall by 1.41% to $4.65. If the $4.58 remains as support, the current downward trend might be reversed, resulting in an upward price movement. But, if the support level is breached, the price may continue to fall.
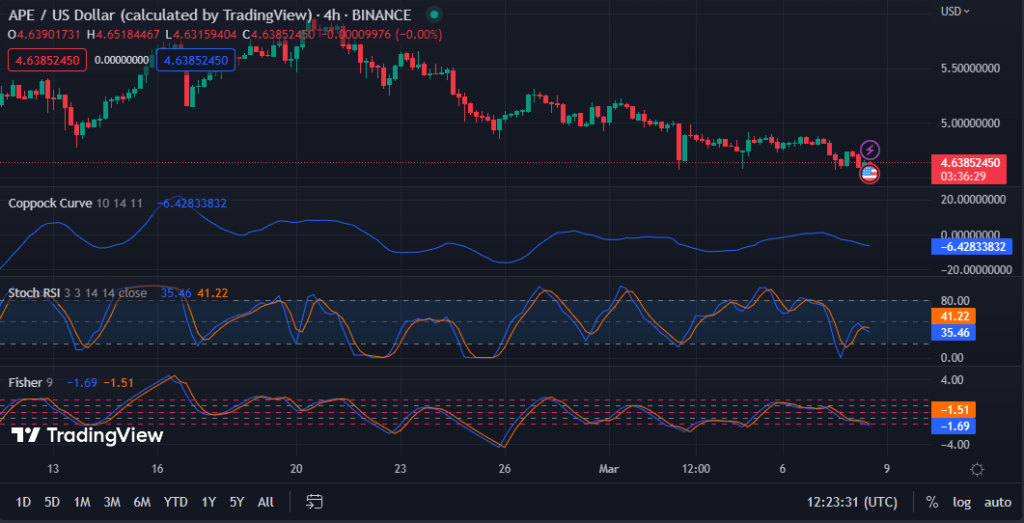
The Coppock Curve on the 4-hour price chart is trending south with a value of -6.46922502, indicating the negative momentum in the APE market is gathering pace. Traders may consider shorting or exiting long positions until the Coppock Curve starts to move higher and shows indications of bullish momentum.
With a stochastic RSI value of 34.87 and falling below its signal line, the asset is presently oversold and might see a short-term price gain before continuing its downward trend. This movement suggests a possible buying opportunity for traders hoping to capitalize on the short-term price gain and liquidate their holdings before the asset starts its downward trend.
With a score of -1.69, the Fisher Transform indicates that the asset is oversold and may undergo a price reversal soon, making it a good opportunity for traders to consider buying in.
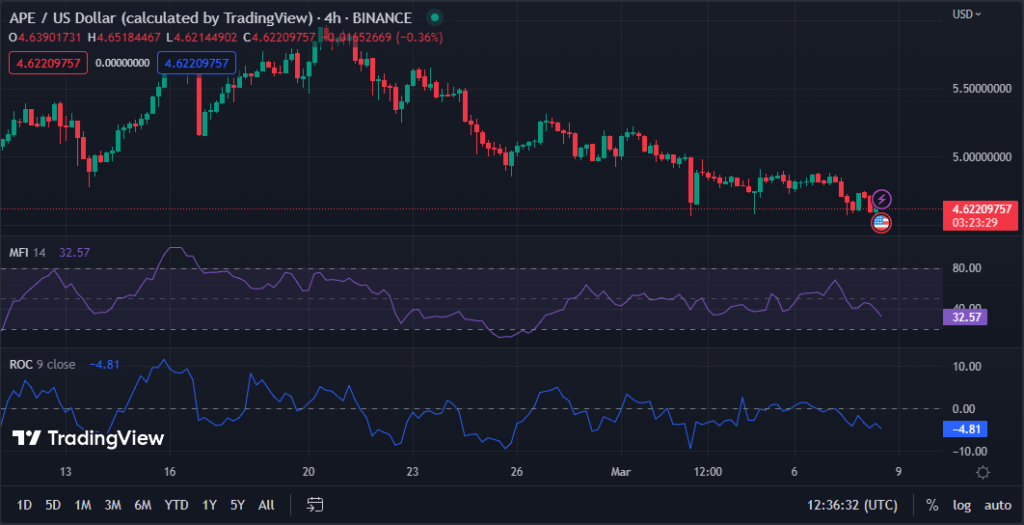
The Money Flow Index (MFI) reading of 32.56 on the APE 4-hour price chart indicates that the market is oversold and that traders may have a buying opportunity. The positive divergence between the MFI and the price movement supports this trend, suggesting that purchasing pressure may soon intensify.
With a value of -4.82, the Rate of Change (ROC) has moved into the negative range, indicating that the velocity of the price fall is intensifying, perhaps leading to further downward movement in the near term. This move reinforces the market’s cynical attitude, and traders should exercise caution when contemplating long positions.
Traders should approach APE cautiously as the negative trend persists, but oversold indicators could signal a potential short-term buying opportunity.
Disclaimer: The views, opinions, and information shared in this price prediction are published in good faith. Readers must do their research and due diligence. Any action taken by the reader is strictly at their own risk. Coin Edition and its affiliates will not be liable for direct or indirect damage or loss.
Disclaimer: The information presented in this article is for informational and educational purposes only. The article does not constitute financial advice or advice of any kind. Coin Edition is not responsible for any losses incurred as a result of the utilization of content, products, or services mentioned. Readers are advised to exercise caution before taking any action related to the company.


