


- Apecoin faces a critical $54.8 million token unlock on Sept 17, stirring market anxiety.
- Despite an 80% YTD price decline, shorting APE ahead of the unlock event is risky.
- APE’s technical indicators signal a potential for further price drops amid strong bearish sentiment.
September stands as a whirlwind month for the cryptocurrency community. Significantly, ApeCoin (APE) is gearing up for a colossal token unlock on September 17 worth $54.8 million, or 11% of the market’s circulating supply.
Analysts predict that insiders and launch donors will get a substantial proportion of these coins. Furthermore, previous instances of such an unlock resulted in a steep drop in APE value. As a result, traders are looking for similar market responses.
Given APE’s price drop throughout the year, Alex Wacy a crypto analyst, flagged the risks of shorting APE. Despite an 80% price decline year-to-date, shorting APE at this stage could invite unintended financial calamity.
APE Price Analysis
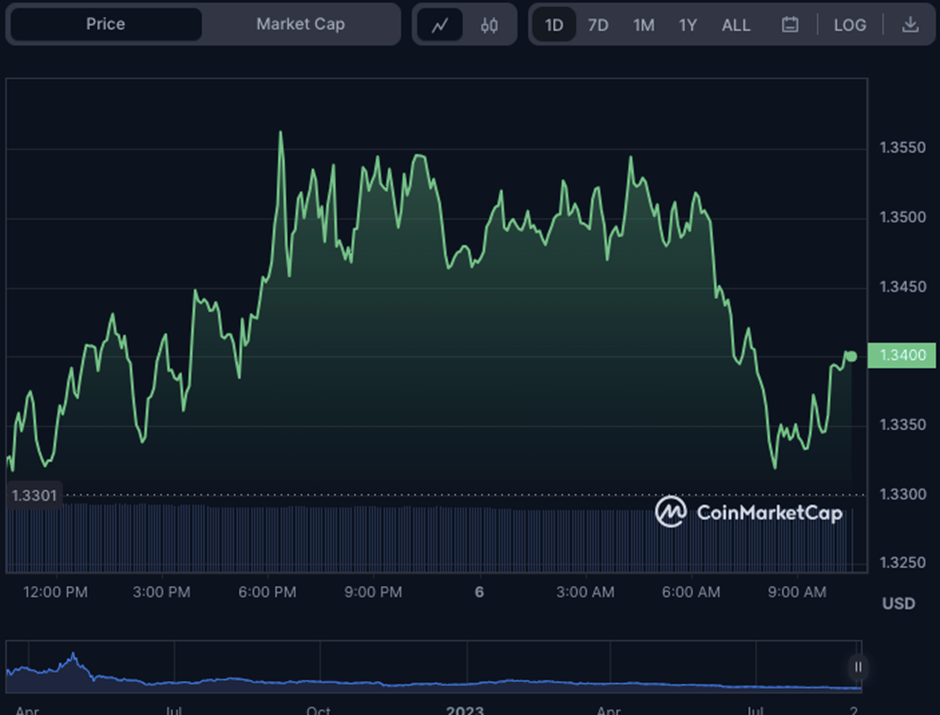
ApeCoin’s price has exhibited signs of resilience recently, oscillating between $1.33 and $1.36 in the last 24 hours. At press time, the APE price was trading at $1.34, hovering around its 52-week low of $1.32.
A slide toward lower support levels at $1.30 and $1.28 could be evidenced if it breaks below this level. However, a bullish reversal could propel the price past the $1.36 resistance level, setting sights on $1.40.
Additionally, moving average indicators offer a glimmer of hope for ApeCoin enthusiasts. The 50-day moving average reads 3.66104709, towering over the 20-day MA of 2.36334431. This trend hints at a waning bearish momentum, raising the possibility of a short-term bullish reversal. Nevertheless, red candlesticks and price activity below both moving averages indicate continued selling pressure.
Moreover, the Relative Strength Index (RSI) at 28.27 confirms the bearish sentiment. Given that the RSI is below the critical 30 mark, the asset is in oversold territory. This move suggests room for further price declines before a potential market turnaround.
The Money Flow Index (MFI) rating of 28.17 indicates negative sentiment, suggesting a substantial outflow from the APE/USD market. This trend indicates that investors are reducing their APE positions, adding to the negative pressure. The low RSI and MFI readings suggest a strong negative trend and a potential additional drop for APE.
Furthermore, the Rate of Change trend in the negative region, with a reading of -32.84, strengthens the bearish attitude for APE. This move shows that the APE’s price has been falling rapidly, reflecting the high selling pressure.
In conclusion, ApeCoin faces a critical moment with a massive token unlock on September 17. While there are glimmers of hope in its technical indicators, caution prevails amid strong bearish sentiment.
Disclaimer: The views, opinions, and information shared in this price prediction are published in good faith. Readers must do their research and due diligence. Any action taken by the reader is strictly at their own risk. Coin Edition and its affiliates will not be liable for direct or indirect damage or loss.
Disclaimer: The information presented in this article is for informational and educational purposes only. The article does not constitute financial advice or advice of any kind. Coin Edition is not responsible for any losses incurred as a result of the utilization of content, products, or services mentioned. Readers are advised to exercise caution before taking any action related to the company.


