


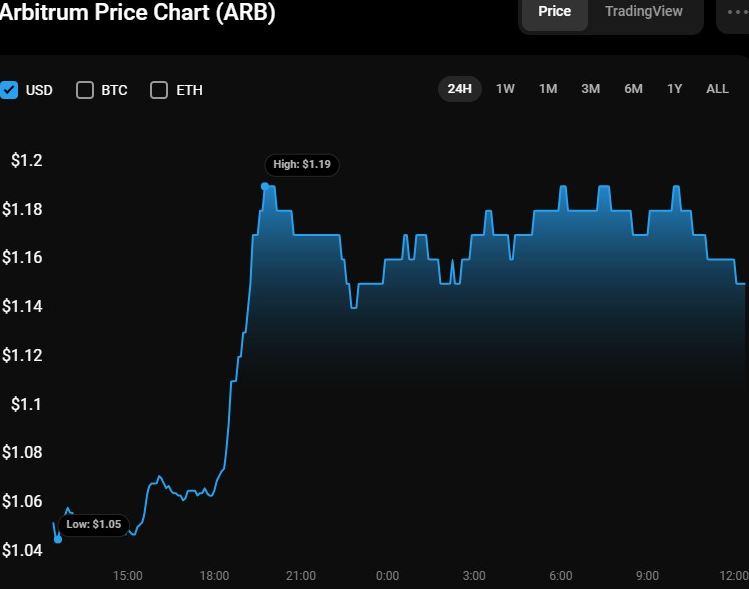
- Arbitrum (ARB) breaks resistance at $1.19, signaling strong bullish momentum.
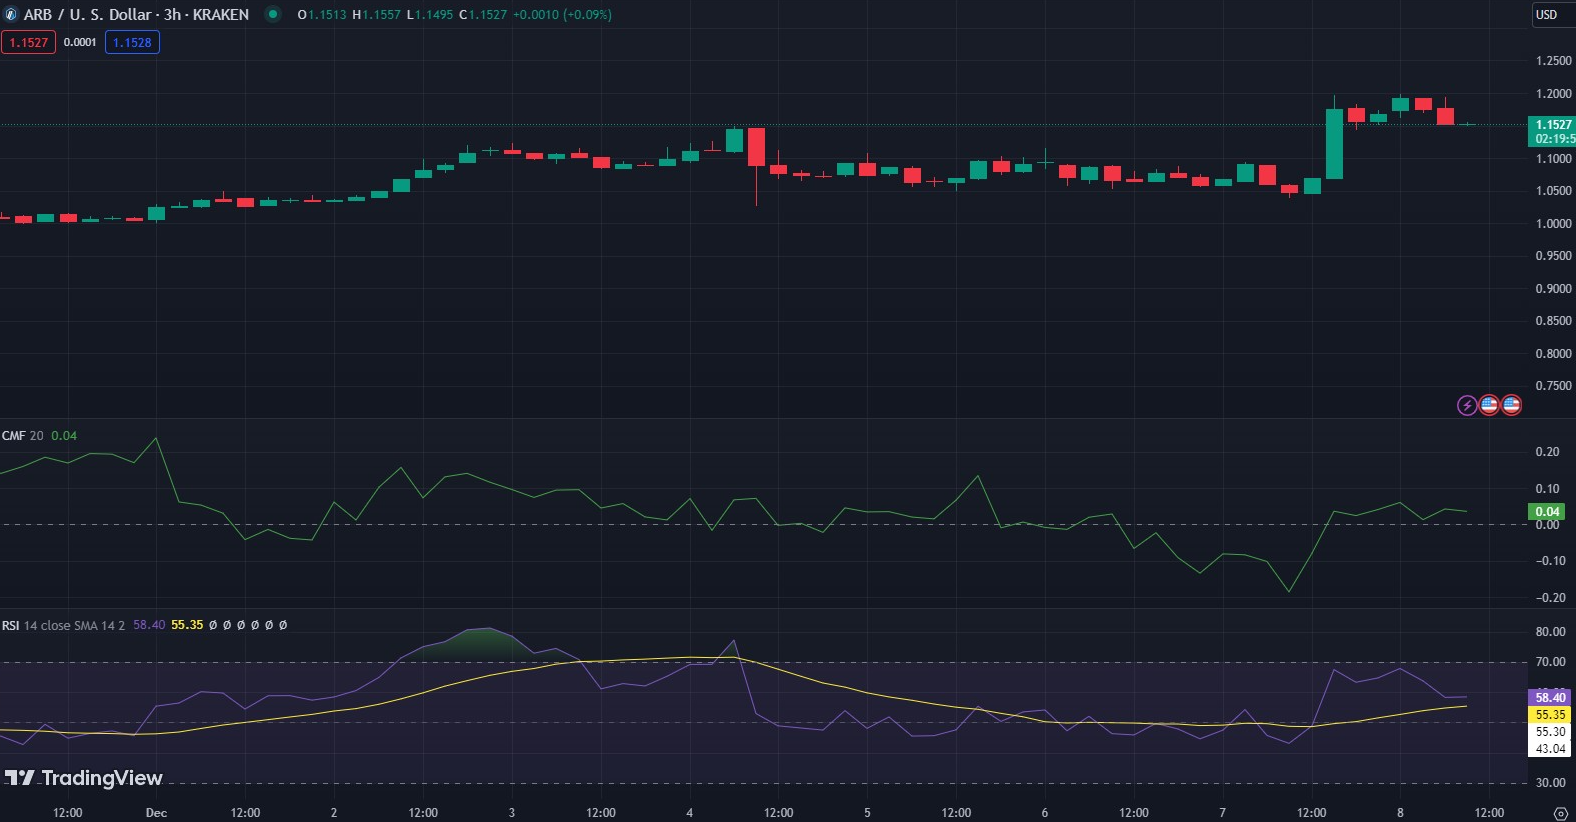
- CMF and RSI indicators hint at continued support for ARB/USD price.
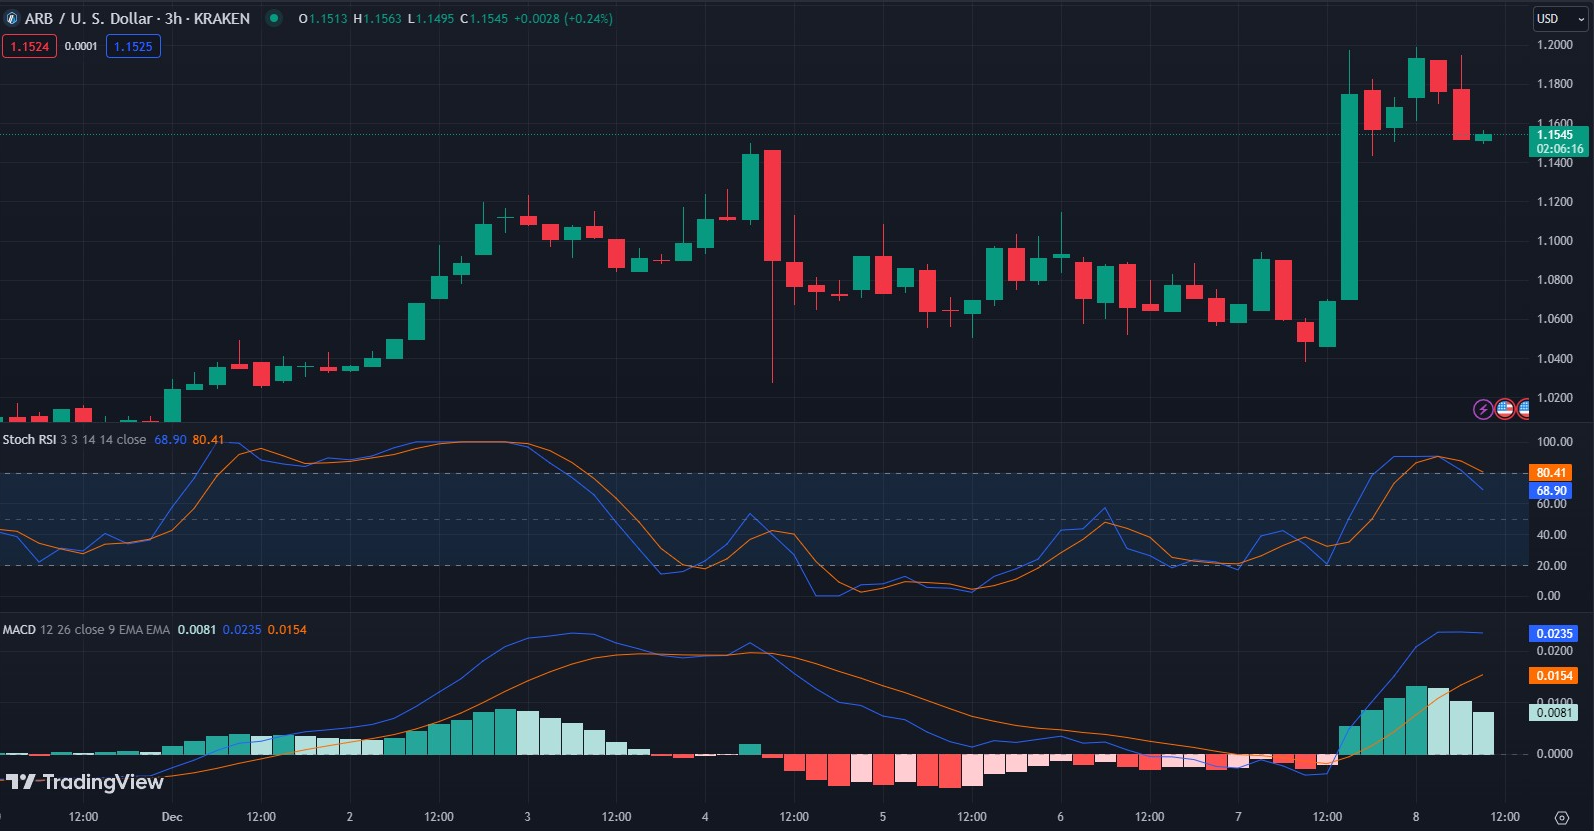
- Indicators point to a potential bearish pressure as stochastic RSI and MACD show mixed signals for ARBUSD.
After a negative trend gripped the Arbitrum (ARB) market in the early hours today, support at $1.04 was tested but held firm. Consequently, bulls reclaimed control and pushed the price of ARB back up to its prior resistance level of $1.19. ARB was priced at $1.16 at the time of publication, reflecting an 8.51% increase from the support level.
The swift price increase reflects substantial market purchasing pressure, implying that investors believe Arbitrum (ARB) can continue its upward trend. If the bullish trend breaks through the $1.19 resistance level, the next level to watch for is around $1.30.
Breaking through this level offers up more upside potential for ARB, as it represents a substantial shift in market sentiment and entices more buyers. During the rally, ARB’s market capitalization and 24-hour trading volume increased by 8.67% and 179.51% to $1,470,763,846 and $862,445,345, respectively. However, suppose the bearish trend takes hold, and the price of ARB falls below the $1.16 support level, then, it might signal a deterioration in investor confidence and ultimately lead to more downward pressure.
On the ARBUSD price chart, the Chaikin Money Flow (CMF) rating of 0.04 indicates that there is now some buying pressure in the market for ARB. Despite the potential downside risks, this trend suggests that there may still be some support for ARB. If the CMF falls below zero, it may indicate a change toward selling pressure and a further drop in the price of ARB.
In addition, the Relative Strength Index (RSI) rating of 58.40 and movement above its signal line indicates that the ARBUSD price may continue to rise. This RSI trend may be a good indicator for buyers because it suggests that there is still some purchasing activity in the market.
However, the stochastic RSI has shifted below its signal line with a rating of 68.97, indicating that purchasing pressure for ARBUSD may be decreasing. If the stochastic RSI falls below the oversold threshold of 20, it could indicate a further decrease in purchasing interest and lead to a negative trend in the price of ARBUSD.
Furthermore, the Moving Average Convergence Divergence (MACD) rating of 0.0238 indicates that ARBUSD is experiencing mild bullish momentum. If the MACD line goes below the signal line and becomes negative, it could imply a shift towards bearish momentum and further losses for ARBUSD. The MACD’s shrinking histogram also suggests a downward trend, indicating a drop in purchasing activity and possibly selling pressure for ARBUSD.
In conclusion, while Arbitrum (ARB) has shown signs of bullish momentum, monitoring key indicators like CMF, RSI, and stochastic RSI for potential shifts is crucial. A break above $1.19 could open doors to higher gains, but a dip below $1.16 might signal caution.
Disclaimer: The information presented in this article is for informational and educational purposes only. The article does not constitute financial advice or advice of any kind. Coin Edition is not responsible for any losses incurred as a result of the utilization of content, products, or services mentioned. Readers are advised to exercise caution before taking any action related to the company.


