
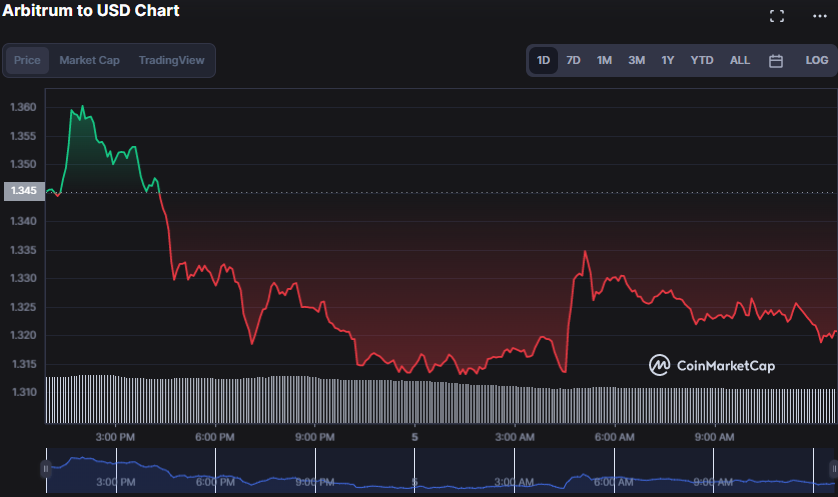
- ARB/USD faces resistance at $1.36, with support at $1.31.
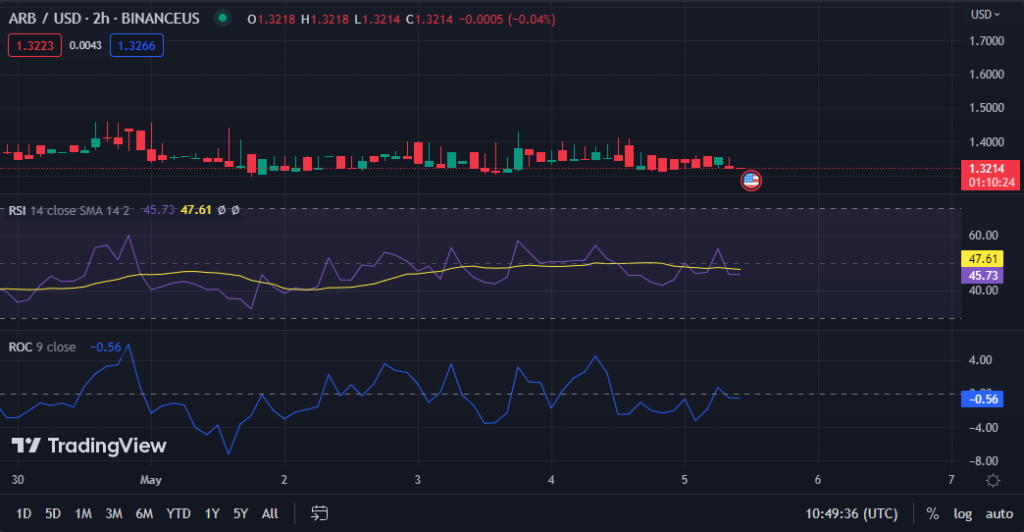
- Bearish momentum may continue with negative RSI and KST readings.
- Negative market sentiment creates a buying opportunity for astute traders.
Arbitrum (ARB) bullishness encountered early resistance at $1.36 and retraced to a 24-hour low of $1.31, where support was formed. As of press time, the bears’ influence was still visible in the 1.95% drop to $1.32.
If the bear market continues to test the $1.31 support level, the next support level to monitor is $1.28, which is vital for bulls to defend. However, if the bullish power recovers from this level, a potential rally towards the $1.40 resistance level may be evident.
During the bear domination, the ARBs market capitalization and 24-hour trading volume fell by 1.90% and 23.96%, respectively, to $1,683,756,070 and $266,870,963.
With an RSI of 45.73 and movement below its signal line, the negative reign in the ARB market may continue, as this movement represents a probable change in market sentiment.
The bear reign has the potential to continue since it hasn’t yet reached the oversold threshold of “30,” so traders should be careful.
With a reading of -0.56, the Rate of Change has also gone into the red, indicating that bearish momentum is gathering speed. However, this change in market mood is not all doom and gloom, as astute traders may see this slump as a buying opportunity.
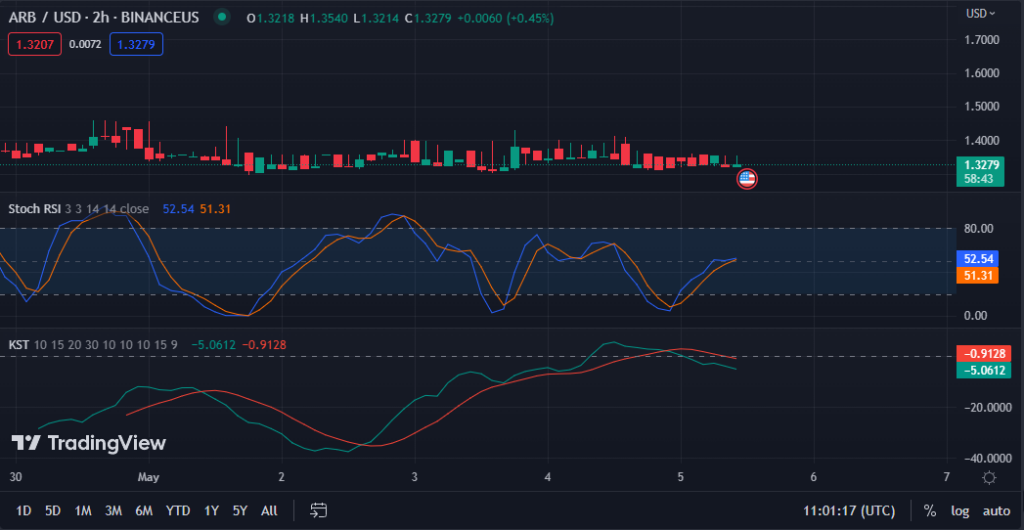
The stochastic RSI on the ARBUSD price chart goes below its signal line with a value of 48.37, adding to the negative momentum. This level and movement south indicate that the ARBUSD price may have further negative potential in the immediate term.
Traders bearish on ARBUSD may consider going short or selling their existing positions to profit from this probable price decrease.
With a value of -5.4763, the Know Sure Thing also dips below its signal line, indicating more selling pressure in the ARB market. If this KST line continues to slip into negative territory, the bearish grip on the price may intensify, pushing it below the support level.
In conclusion, the ARB market faces bearish pressure, with key support levels to watch. Traders must exercise caution and consider shorting opportunities as the negative momentum persists.
Disclaimer: The views, opinions, and information shared in this price prediction are published in good faith. Readers must do their research and due diligence. Any action taken by the reader is strictly at their own risk. Coin Edition and its affiliates will not be liable for direct or indirect damage or loss.
Disclaimer: The information presented in this article is for informational and educational purposes only. The article does not constitute financial advice or advice of any kind. Coin Edition is not responsible for any losses incurred as a result of the utilization of content, products, or services mentioned. Readers are advised to exercise caution before taking any action related to the company.


