


 Rising Market Share Leaves Base in the Dust")
- Cryptocurrency researcher Emperor Osmo revealed in an X post yesterday that Arbitrum continues to outshine Base.
- According to the post, a 50 million ARB stimulus is finally paying off.
- At press time, ARB’s price was down 0.22% and was trading hands at $1.03.
The pseudonymous cryptocurrency researcher Emperor Osmo revealed in an X post yesterday that Arbitrum (ARB) continues to build its market share lead over Base. According to the post, a 50 million ARB stimulus deployed to the network is finally starting to pay off. The X user predicted that this may be “just the start of the rotation.”
The growth in ARB’s market share was not echoed by its price, which recorded a 0.22% drop over the past 24 hours. As a result of this latest decrease, the cryptocurrency was changing hands at $1.03 at press time, according to CoinMarketCap.
In addition to the price drop, ARB also saw its trading volume decrease by more than 31% throughout the past 24 hours. Subsequently, the total daily trading volume stood at $174,961,983.
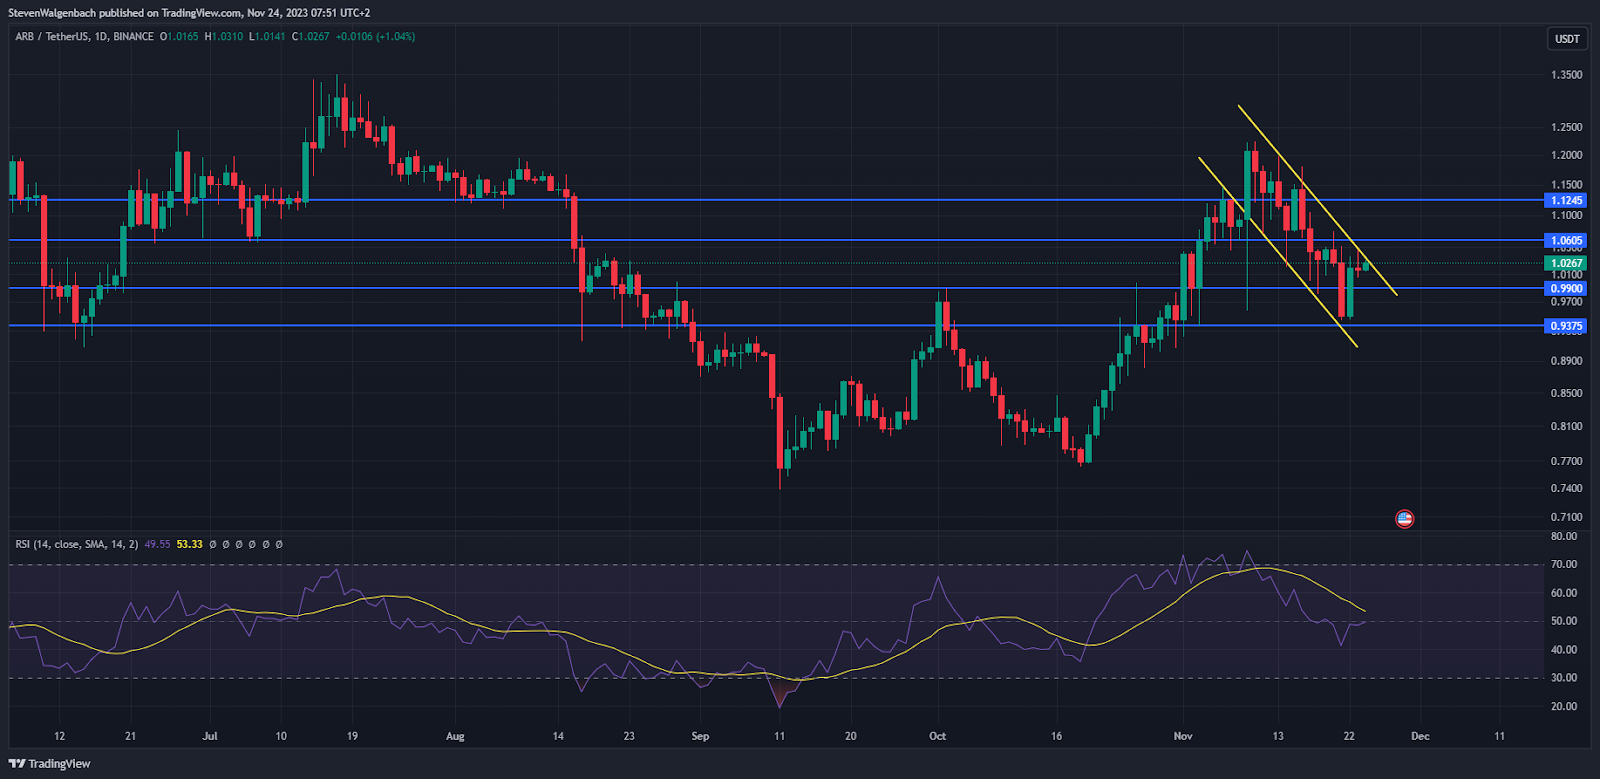
From a technical perspective, ARB was attempting to break above a negative price channel that had formed on its charts over the past 2 weeks. If the cryptocurrency is able to escape this channel, then it may continue to rise. This potential move to the upside may include an attempt at flipping the $1.0605 resistance level into support.
A daily candle close above $1.0605 could then give the cryptocurrency the foundation needed to rise to the subsequent threshold at $1.1245 in the following few days. This bullish thesis could be invalidated, however, if ARB fails to close a daily candle above the negative price channel within the next 48 hours.
In this more bearish scenario, ARB could be at risk of falling to the immediate support level at $0.99. Continued sell pressure may then drag the altcoin’s value below this significant price point to a potential low of $0.9375.
Buyers seemed to be growing stronger on ARB’s daily chart. At press time, the daily Relative Strength Index (RSI) line was rising towards the RSI Simple Moving Average (SMA) line. If these two technical indicators cross, it may indicate a strong shift in momentum that favors bulls.
Disclaimer: The information presented in this article is for informational and educational purposes only. The article does not constitute financial advice or advice of any kind. Coin Edition is not responsible for any losses incurred as a result of the utilization of content, products, or services mentioned. Readers are advised to exercise caution before taking any action related to the company.


