


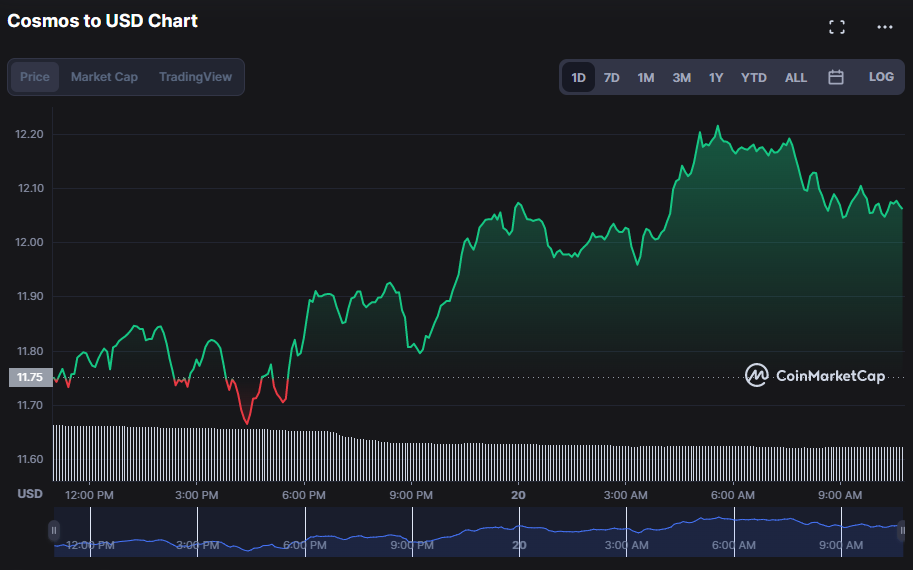
- Due to market demand, the price of ATOM rises by 2.14%.
- After finding support at $11.65, the bulls were able to break the bears’ grip.
- If ATOM manages to break out over the $12.22 resistance mark, its price might surge.
In the last 24 hours, bullish predominance has remained in the Cosmos (ATOM) market, with prices reaching a high of $12.22 before facing resistance. When the ATOM price dropped to a 24-hour low of $11.65, the market regained support, bullish control took effect. At the time of publication, the bullish trend has effectively increased the ATOM price by 2.14% to $12.08.
The market capitalization jumped by 2.58% to $3,453,096,029, showing that investor confidence in ATOM has increased; nevertheless, the 24-hour trading volume fell by 39.59% to $122,385,519. This trend implies that investors are becoming more confident in ATOM’s progress, but they are not yet willing to participate in a more volatile market with greater stakes.
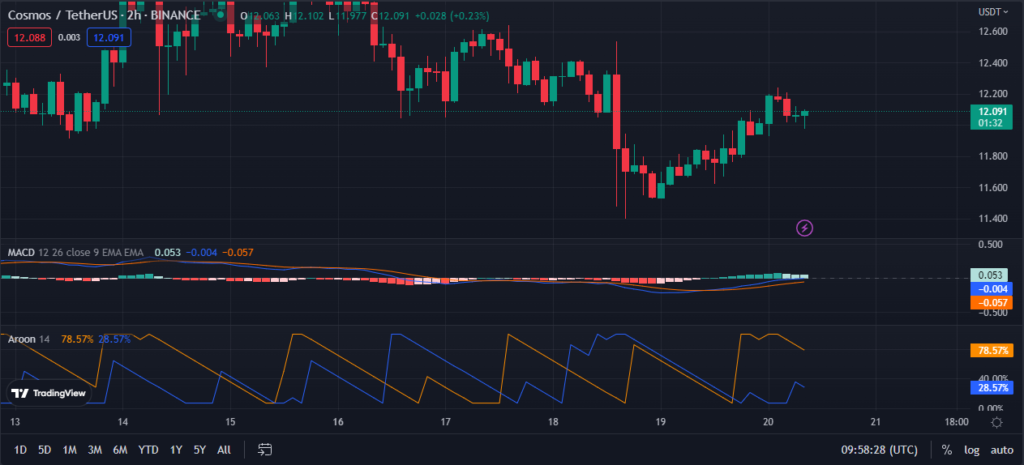
Further positive confirmation of ATOM’s climb is predicted as the MACD blue line rises above the signal line with a value of -0.008. This notion suggests that investors are confident in ATOM’s growth prospects, but are not yet willing to make high-risk, high-reward trades. However, because it is in the negative region, it indicates that investors are hesitant to enter the market and prefer to observe for a longer period of time.
This bullish notion is additionally forecast on the ATOM price chart with an Aroon Up reading of 78.57% and an Aroon Down reading of 28.57%. These readings show that the market is being driven by longer-term investors who are confident in ATOM’s expansion but are wary about making large investments.
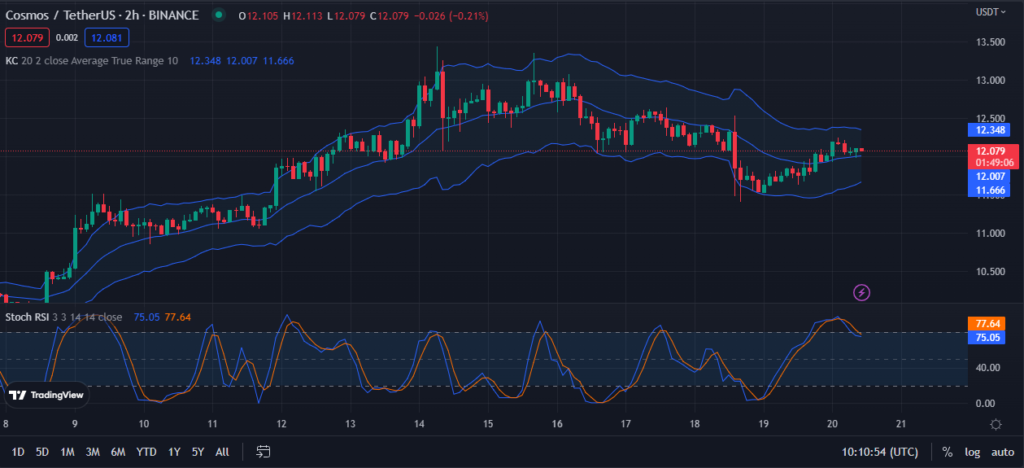
As the Keltner Channel bands expand and move linearly, the price of ATOM is expected to increase, with peaks at $12.347 and $11.670, respectively. As shown in the price chart, wider bands indicate more volatility in ATOM, suggesting that prices will continue to follow these ranges. The wider bands of the Keltner Channel may be used as purchase indications since the underlying price is trending upward.
Given that the ATOM market’s stochastic RSI is now at 75.70 and trending below its signal line, shorting opportunities may exist in the near future. This action urges investors to exercise prudence in their ATOM investments and to be prepared to liquidate holdings if a sell-off occurs.
In order to thwart the bears’ efforts to grab control of the ATOM market, the bulls must push prices higher and defend the existing resistance level.
Disclaimer: The views and opinions, as well as all the information shared in this price analysis, are published in good faith. Readers must do their own research and due diligence. Any action taken by the reader is strictly at their own risk, Coin Edition and its affiliates will not be held liable for any direct or indirect damage or loss.
Disclaimer: The information presented in this article is for informational and educational purposes only. The article does not constitute financial advice or advice of any kind. Coin Edition is not responsible for any losses incurred as a result of the utilization of content, products, or services mentioned. Readers are advised to exercise caution before taking any action related to the company.


