


- AVAX defies bears as positive momentum drives it to a 24-hour high of $13, showing strong investor enthusiasm
- AVAX’s market cap rises, signaling long-term potential, while overbought conditions hint at possible short-term correction
- Breaking the $13 resistance could pave the way for AVAX to reach new heights, but a dip below $12 may shift market sentiment
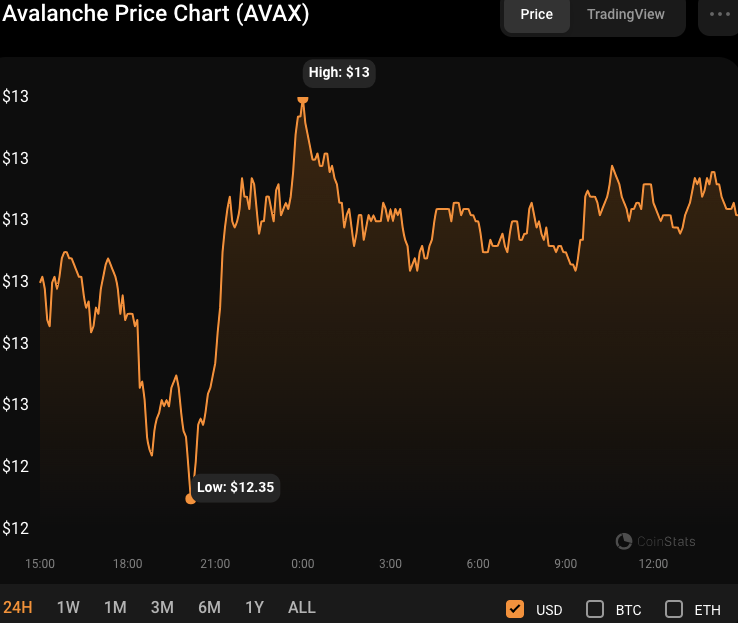
Despite bears having the upper hand in the Avalanche (AVAX) market in the early hours of the day, positive momentum nullified the trend. During the bear rally, the AVAX market fell to an intra-day low of $12.36, where buyers swiftly stepped in to boost the price back up.
As a result, investors drove the AVAX price to a 24-hour high of $13 before a modest drop. At press time, the bulls were still in power, with AVAX trading at $12.80, a 0.97% increase. This rise in bullish activity implies that AVAX is in high demand, implying that investors are enthusiastic about its prospects.
AVAX’s market capitalization increased by 0.19% to $4,546,451,034 during the positive rebound, but its 24-hour trading volume decreased by 1.19% to $215,670,662. This implies that, despite the slight correction, there is still considerable interest and activity in AVAX. The rise in market capitalization indicates that investors believe in the cryptocurrency’s long-term potential, while the fall in trading volume may signal a temporary slowdown in trading activity.
If the bullish momentum breaks over the 24-hour hurdle, the next levels to look for are around $14.50, $17, and possibly $20. This resistance and level at $13 have long served as a critical barrier for AVAX, and a successful break over it may result in additional price growth.
However, if the bulls fail to maintain their pace and the price retraces, a significant support level to watch is around $12. A breach below this level might indicate a change in market mood and draw selling pressure from profit-taking traders.
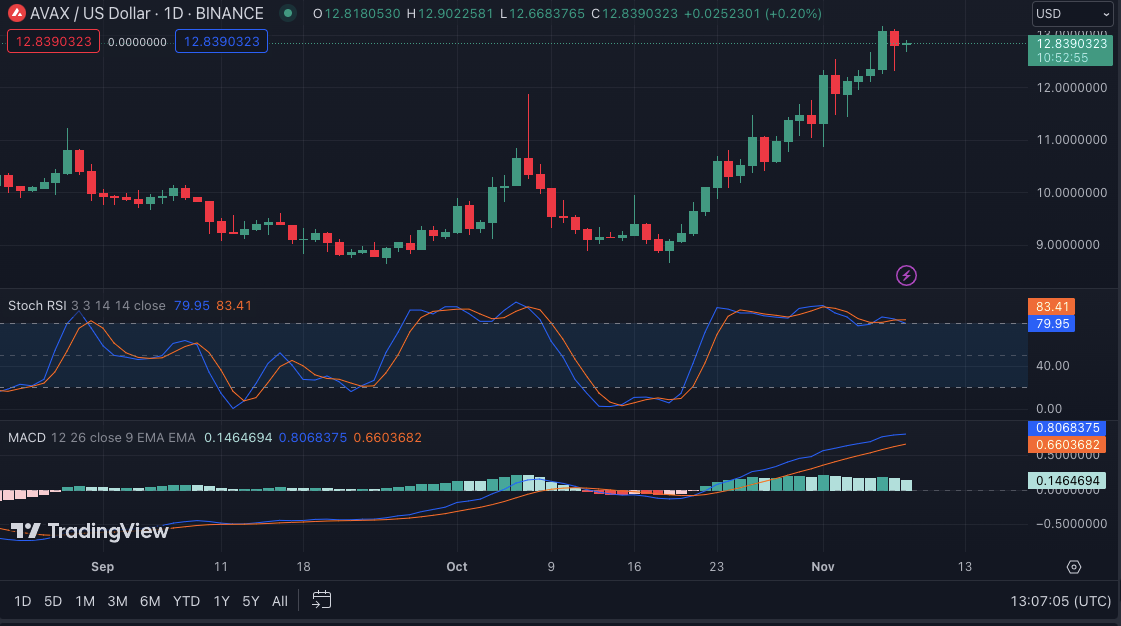
AVAX/USD Technical Analysis
The stochastic RSI rating of 76.99 and movement below its signal line indicate that AVAX may be overbought in the short term. Because overbought conditions often lead to a correction or a period of sideways movement, this trend might imply a likely reversal or consolidation soon. If the stochastic RSI goes below the overbought level of 70, it might indicate a change in momentum and a likely drop in the price of AVAX.
However, the Moving Average Convergence Divergence (MACD) is still in the positive range, with a value of 0.8047608, indicating that there is still bullish momentum in AVAX. This pattern shows that, despite being overbought, the market is still experiencing purchasing pressure, which might increase the price. Furthermore, the MACD histogram displays positive values, confirming the existence of bullish momentum.
In conclusion, AVAX exhibits strong bullish sentiment, aiming to break key resistance levels. However, caution is warranted, as overbought conditions may trigger a correction soon.
Disclaimer: The information presented in this article is for informational and educational purposes only. The article does not constitute financial advice or advice of any kind. Coin Edition is not responsible for any losses incurred as a result of the utilization of content, products, or services mentioned. Readers are advised to exercise caution before taking any action related to the company.


