


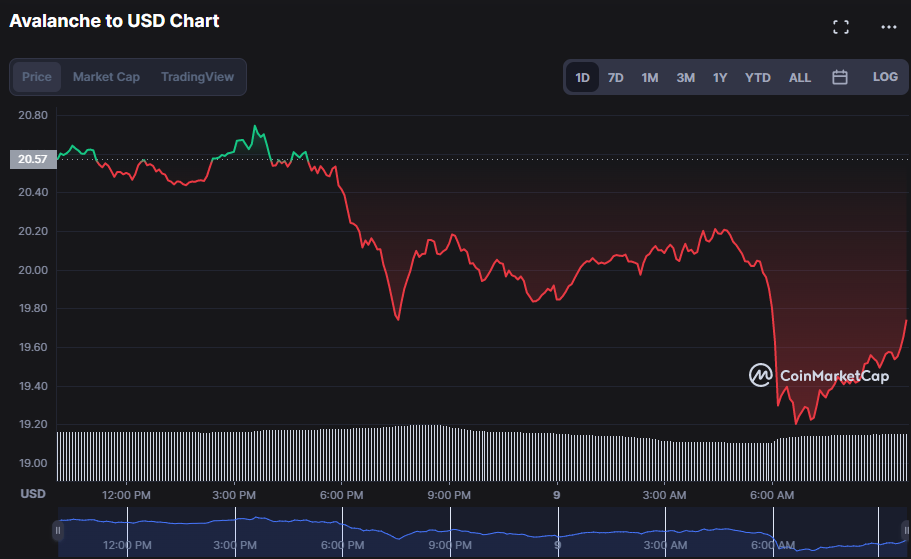
- Bulls in AVAX backtrack after hitting resistance at $20.76.
- The AVAX market finds support around $19.19 throughout the slump.
- Indicators imply that bear strength is increasing.
Bulls in the Avalanche (AVAX) market have retraced recently after encountering resistance at the intra-day high of $20.76. However, as of press time, bearish momentum persisted in the AVAX market, effectively lowering the price by 4.38% to $19.70. The bears’ performance in the AVAX market was due to a lack of purchasing demand and increased selling pressure, both of which pushed the price down.
During the downturn, market capitalization, and 24-hour trading volume declined by 4.47% and 3.05%, respectively, to $6,206,085,709 and $304,863,545. Despite the selling pressure and downward momentum, the bulls were able to limit their losses as the AVAX price hit support around $19.19, barring it from plunging any lower.
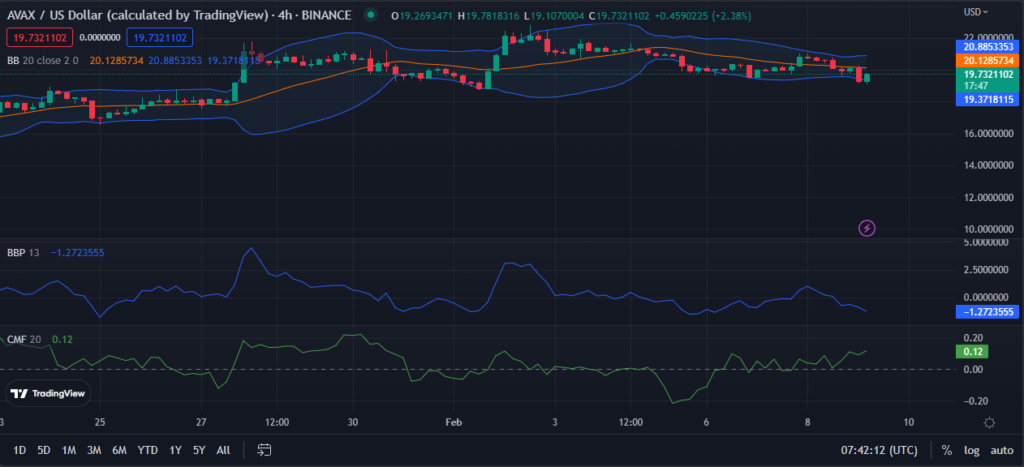
The AVAX market is now trading inside a relatively tight range, with upper and lower Bollinger bands of 20.8903101 and 19.3600848, respectively, indicating that the AVAX market is highly volatile and susceptible to price drops. As the price oscillates towards the lower band and develops a green candlestick, the possibility for a price decrease is underlined, which may present a good chance for traders to profit from the AVAX long-term potential.
The Bull Bear Power (BBP) trend south on the 4-hour price chart with a reading of -1.2540318 also indicates a bearish bias in the AVAX market and suggests that the potential for a price drop is real. This price drop anticipation is because the BBP suggests that the bears are pushing the price down and could cause it to break through the lower Bollinger band, creating an opportunity to enter the market and benefit from any potential gains made by investing in AVAX.
However, since the Chaikin Money Flow (CMF) is trending north with a value of 0.11, the AVAX market may break out of its current range and advance towards its upper band, signaling bullish momentum. This upward movement increases traders’ confidence in a possible trend reversal in the near term if bulls continue to fight.
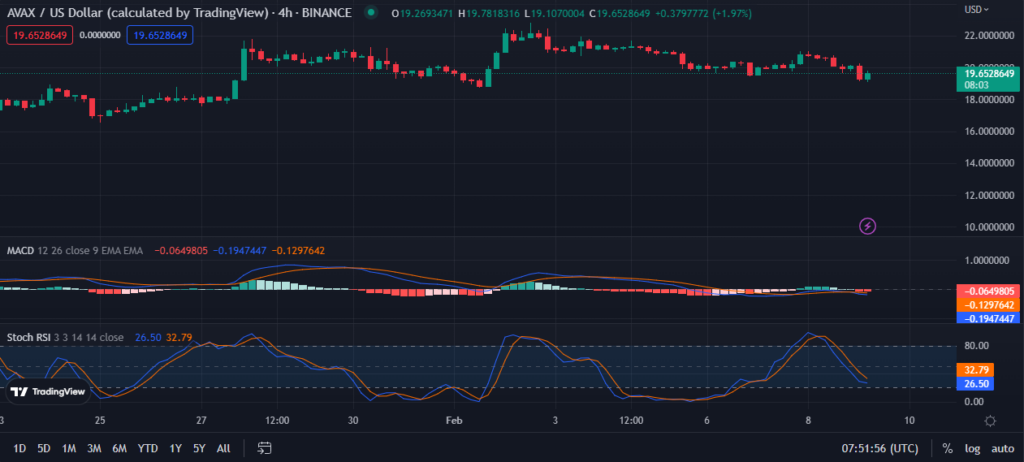
The AVAX market continues its downward trend as the MACD blue line moves below its signal line, pointing south (now at -0.1886214). This downward trend indicates that selling pressure is higher than purchasing stress and that the bearish mood may persist for the time being.
The stochastic RSI is also trending below its signal line with a value of 28.12 and trending south, indicating a prolonged bear run. Based on the direction of the stochastic RSI, oversold conditions are apparent in the AVAX market, and negative momentum is significant.
Bulls must apply pressure and drive prices upward to counteract the bearish trend in the AVAX market.
Disclaimer: The views and opinions, as well as all the information shared in this price analysis, are published in good faith. Readers must do their own research and due diligence. Any action taken by the reader is strictly at their own risk, Coin Edition and its affiliates will not be held liable for any direct or indirect damage or loss.
Disclaimer: The information presented in this article is for informational and educational purposes only. The article does not constitute financial advice or advice of any kind. Coin Edition is not responsible for any losses incurred as a result of the utilization of content, products, or services mentioned. Readers are advised to exercise caution before taking any action related to the company.


