


 Price Prediction 2024-2030: Will AXS Price Hit $15 Soon?")
- By 2027, AXS could hit $39.33, driven by BTC halving anticipation, or drop to $13.27.
- In 2029, AXS might peak at $82.35 as market momentum builds or dip to $39.15 post-halving.
- AXS might hit $200 by 2040, reflecting long-term growth, or dip to $130.99 due to challenges.
Axie Infinity (AXS) has evolved from a simple gaming platform into a major player in the blockchain space, attracting gamers and investors alike. Blending gameplay with blockchain technology, its advanced approach has garnered attention worldwide.
The platform’s native token, AXS, isn’t just a currency—it’s a gateway to gaming earnings, and its success has been nothing short of remarkable. Since its debut, AXS has delivered an astonishing ROI of 3,713.12% despite the industry’s ups and downs.
This kind of performance has many market watchers questioning whether now is the time to invest in AXS before it potentially skyrockets. Moreover, the platform’s ability to generate revenue and maintain its appeal has kept it in the spotlight, raising the stakes for what’s next.
As we look ahead, the big question is: Will AXS continue its meteoric rise, or will it falter? This article delves into the most likely price predictions for AXS from 2024 to 2030, exploring the potential highs and lows. Let’s find out more.
Table of contents
- Axie Infinity (AXS) Market Overview
- What is Axie Infinity (AXS)?
- Axie Infinity (AXS) Current Market Status
- Axie Infinity (AXS) Price Analysis
- Axie Infinity (AXS) Price Prediction 2024
- Axie Infinity (AXS) Price Prediction 2025
- Axie Infinity (AXS) Price Prediction 2026
- Axie Infinity (AXS) Price Prediction 2027
- Axie Infinity (AXS) Price Prediction 2028
- Axie Infinity (AXS) Price Prediction 2029
- Axie Infinity (AXS) Price Prediction 2030
- Axie Infinity (AXS) Price Prediction 2040
- FAQs
Axie Infinity (AXS) Market Overview
| 🪙 Name | Axie Infinity |
| 💱 Symbol | AXS |
| 🏅 Rank | #137 |
| 💲 Price | $0.94173500527898 |
| 📊 Price Change (1h) | 0.01 % |
| 📊 Price Change (24h) | -6 % |
| 📊 Price Change (7d) | -6.94 % |
| 💵 Market Cap | $164061844.8048 |
| 💸 Circulating Supply | 174212325.00134 AXS |
| 💰 Total Supply | 270000000 AXS |
Axie Infinity (AXS) is currently trading at $0.94173500527898 and sits at number #137 on CoinMarketCap in terms of market capitalization. There are 174212325.00134 AXS coins currently in circulation, bringing the total market cap to $164061844.8048.
Over the past 24 hours, Axie Infinity has decreased by 6%. Looking at the last week, the coin is down by 6.94%.
What is Axie Infinity (AXS)?
Axie Infinity (AXS) is a revolutionary blockchain game that blends the thrill of Pokémon-style gameplay with the earning potential of cryptocurrency. In this vibrant digital universe, players collect, breed, and battle digital creatures called Axies, each a unique non-fungible token (NFT) with its own set of characteristics and value.
Since its launch in 2018 by Vietnamese studio Sky Mavis, Axie Infinity has captured the attention of the gaming and crypto communities alike. The game’s appeal lies in its dual token economy, featuring Axie Infinity Shards (AXS) and Smooth Love Potions (SLP).
AXS is the game’s governance token, giving players a say in the platform’s future, while SLP can be earned through gameplay and used to breed new Axies, adding another layer of strategy to the experience.
But Axie Infinity is more than just a game; it’s an entire ecosystem where players can trade Axies, develop land, and even stake their AXS tokens for rewards. What truly sets Axie Infinity apart is its focus on community-driven content and governance, promising a future where players don’t just play the game—they help shape it.
Axie Infinity (AXS) Current Market Status
AXS has been on a rollercoaster ride this week, defying early bearish predictions with a surprising turnaround. After a shaky start, AXS regained momentum, soaring to a weekly high of $4.73 before settling just above the crucial $4.60 support level.
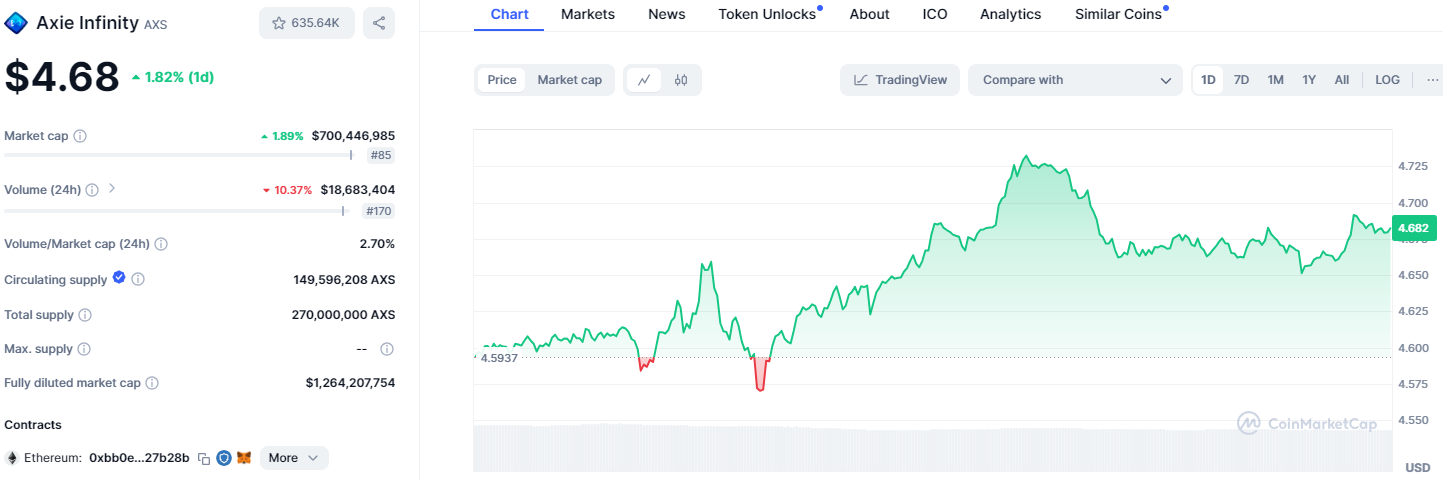
This unexpected resilience has sparked optimism among investors, with the token currently trading at $4.68, marking a 1.82% increase in just 24 hours. Despite this upbeat performance, a contrasting picture emerges in trading volume, which has dropped by 10.37% to $18.68 million.
While AXS’s market cap has climbed to over $700 million, solidifying its place as the 85th largest cryptocurrency, the decline in volume hints at possible profit-taking or market consolidation.
Axie Infinity (AXS) Price Analysis
With a circulating supply of nearly 150 million AXS out of 270 million, the potential for future growth remains vast. As more tokens enter the market, trading activity could surge, driving up market cap and attracting new investors eager to capitalize on AXS’s growth trajectory. Here, Coin Edition delves deeper into the factors driving the fluctuation in AXS’s price and explores potential future trends in the market.
Axie Infinity (AXS) Price Analysis – Bollinger Bands
The weekly AXS Bollinger Bands indicate the token has been under a prolonged bearish sentiment from late 2022 to 2023. Since then, AXS has been moving sideways, with no clear bullish or bearish trend, suggesting a consolidation phase reflecting investors’ indecision. This could lead to potential price volatility in the near term.
Currently, AXS is showing a weak bullish sentiment as it attempts to climb from the lower Bollinger Band at $3.59 toward the middle band at $5.93. However, if it fails to break through this middle band resistance, the token may remain range-bound within the Bollinger Bands, continuing its sideways trend.
Axie Infinity (AXS) Price Analysis – Relative Strength Index
The RSI index supports this indecisive market behaviour, hovering around the 40 level, which suggests a balanced market sentiment. A break above the neutral 50 mark on the RSI could signal a shift towards a more bullish trend, potentially driving AXS to challenge the significant resistance level at $13.27.
On the other hand, if the RSI drops toward the 30 mark, it may indicate an oversold condition, leading to a bearish trend where AXS could test the support level at $0.66 before finding a new direction.
Axie Infinity (AXS) Price Analysis – Moving Average Convergence Divergence
Similarly, the MACD index also suggests a period of consolidation, with the MACD line and signal line converging around the zero level. The MACD, currently at -0.8533, is close to crossing over the signal line, which could signal a potential bullish trend in the near term, possibly pushing AXS towards the $13.27 resistance level.
Conversely, if the MACD fails to cross over and instead moves lower, it may indicate a bearish trend, with the token testing lower support levels.
Axie Infinity (AXS) Price Prediction 2024
The current DMI index reveals a bearish trend, as the -DI at 26.1295 is significantly higher than the +DI, which stands at 16.4949. This indicates that downward pressure is outweighing upward momentum in the market.
However, the ADX reading of 18.6048 suggests that while the bearish trend is present, it lacks solid directional strength, reflecting a relatively weak trend overall.
Following these market conditions, AXS is at a critical juncture. If the token can maintain its weak bullish sentiment and successfully break through the resistance at the middle Bollinger Band around $5.93, it could trigger a more substantial upward movement.
This scenario, supported by a potential crossover in the MACD and a rising RSI, might propel AXS to challenge its next major resistance at $13.27. On the flip side, if AXS fails to sustain its momentum and the MACD line diverges further below the signal line, coupled with a dip in the RSI toward the 30 mark, the token could face a significant bearish turn.
This likely leads to a retest of the lower Bollinger Band and the key support level around $0.66, potentially driving the token to new lows before finding a stable direction.
Axie Infinity (AXS) Price Prediction 2025
Per Coin Edition’s projections, AXS could peak at $20 in 2025, fueled by post-BTC halving optimism. However, it may dip to $8 due to potential market corrections and fading hype from the 2024 halving.
Axie Infinity (AXS) Price Prediction 2026
According to our price forecast, AXS might reach $15.55 in 2026 as the market stabilizes post-corrections. On the downside, it could fall to $6.78, reflecting a diminished impact from the previous year’s halving.
Axie Infinity (AXS) Price Prediction 2027
Coin Edition suggests that AXS could surge to $39.33 in 2027, driven by renewed anticipation of the 2028 BTC halving. Conversely, if market conditions remain uncertain, the token may bottom out at $13.27.
Axie Infinity (AXS) Price Prediction 2028
AXS is likely to touch $63.32 in 2028, buoyed by the BTC halving and strong community support. Nevertheless, it could also see a low of $28.16 due to potential profit-taking and market volatility.
Axie Infinity (AXS) Price Prediction 2029
Per Coin Edition, AXS may peak at $82.35 in 2029 as the crypto market gains momentum. Nonetheless, it could drop to $39.15 if market corrections occur after the 2028 halving excitement wanes.
Axie Infinity (AXS) Price Prediction 2030
Our forecast indicates AXS could hit $102.40 in 2030, driven by sustained community engagement and broader adoption. On the flip side, if global economic conditions affect investor confidence, it might dip to $69.18.
Axie Infinity (AXS) Price Prediction 2040
Coin Edition predicts that 2040 AXS could soar to $200, reflecting long-term growth and ecosystem expansion. Conversely, depending on technological challenges and market saturation, the token might face lows of around $130.99.
FAQs
Axie Infinity (AXS) is a blockchain game where players collect, breed, and battle digital creatures called Axies. AXS is the game’s governance token, allowing players to influence the platform’s future.
You can buy Axie Infinity (AXS) on major cryptocurrency exchanges like Binance, Coinbase, and Kraken. You can purchase AXS using fiat or other cryptocurrencies like Bitcoin or Ethereum.
Axie Infinity (AXS) has shown strong performance with significant ROI. However, as with any investment, it carries risks, so research and consider market conditions before investing.
AXS reached an all-time high of approximately $165.37 in November 2021, driven by intense community engagement and market momentum.
According to projections, AXS could reach $50 by 2028, driven by market momentum and community support. However, it is subject to market volatility and other factors.
As of 2024, the circulating supply of AXS is nearly 149,597,303 tokens out of 270 million.
According to our price prediction forecast, AXS is anticipated to surpass its all-time high by 2040 and peak around the $200 threshold.
The lowest price for AXS was approximately $0.1234 in November 2020, during its early stages, before gaining significant traction.
Axie Infinity was founded by Sky Mavis, a Vietnamese game development studio co-founded by Trung Nguyen, Aleksander Larsen, and Jeffrey Zirlin in 2018.
Sky Mavis created the game, and it was first released in 2018. However, it only gained mainstream popularity in 2021, as interest in crypto gaming and NFTs skyrocketed.
Since AXS is an ERC-20 token, you can store it in any ERC-20-compatible wallet, ensuring a secure and reliable method of managing your tokens.
2024 AXS might face a range-bound market between $5.93 and $13.27, with potential upward or downward trends based on market sentiment.
In 2025, AXS could reach $20 due to post-BTC halving optimism, with potential lows around $8 due to market corrections.
AXS might hit $15.55 in 2026 as the market stabilizes post-corrections, with a downside of $6.78 if momentum fades.
In 2027, AXS could peak at $39.33, driven by BTC’s halving anticipation and possibly low at $13.27 amid market uncertainties.
By 2028, AXS may touch $63.32, supported by BTC halving, with a potential low of $28.16 due to profit-taking and volatility.
In 2029, AXS might peak at $82.35 as the market gains momentum, with a possible dip to $39.15 if corrections occur post-halving.
By 2030, AXS could reach $102.40, driven by community engagement and adoption, with a potential low of $69.18 if global conditions impact investor confidence.
In 2040, AXS might soar to $200, reflecting long-term growth, or dip to $130.99 due to technological challenges and market saturation.
Disclaimer: The information presented in this article is for informational and educational purposes only. The article does not constitute financial advice or advice of any kind. Coin Edition is not responsible for any losses incurred as a result of the utilization of content, products, or services mentioned. Readers are advised to exercise caution before taking any action related to the company.


 Price Prediction 2026, 2027, 2028, 2029, 2030-2050")
