


- Bears are dominating the SHIB market despite CoinMENA listings news.
- SHIB/USD is showing signs of a positive reversal with green candlesticks.
- RSI and TRIX are suggesting that the market’s negative momentum is fading for SHIB.
Despite the news on May 15 that it would be listed on Bahrain’s Central Bank Regulated Exchange, CoinMENA, the Shiba Inu (SHIB) market has been dominated by bears in the previous 24 hours.
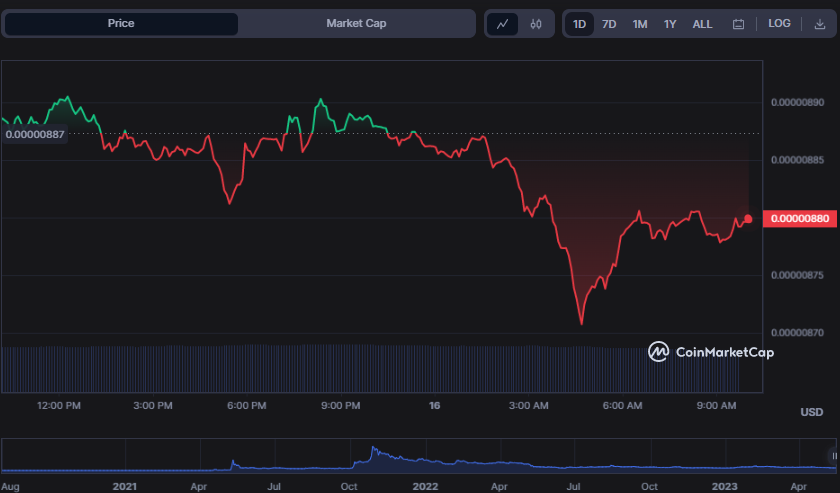
Due to the negative momentum, the SHIB price fell from an intra-day high of $0.000008907 to a low of $0.000008707 (support). As of press time, the bear’s hand was strong in the SHIB market, triggering a 0.94% drop to $0.000008797 from the previous closing.
During the slump, SHIB’s market capitalization and 24-hour trading volume declined by 1.01% and 7.79%, respectively, to $5,185,635,602 and $90,016,197.
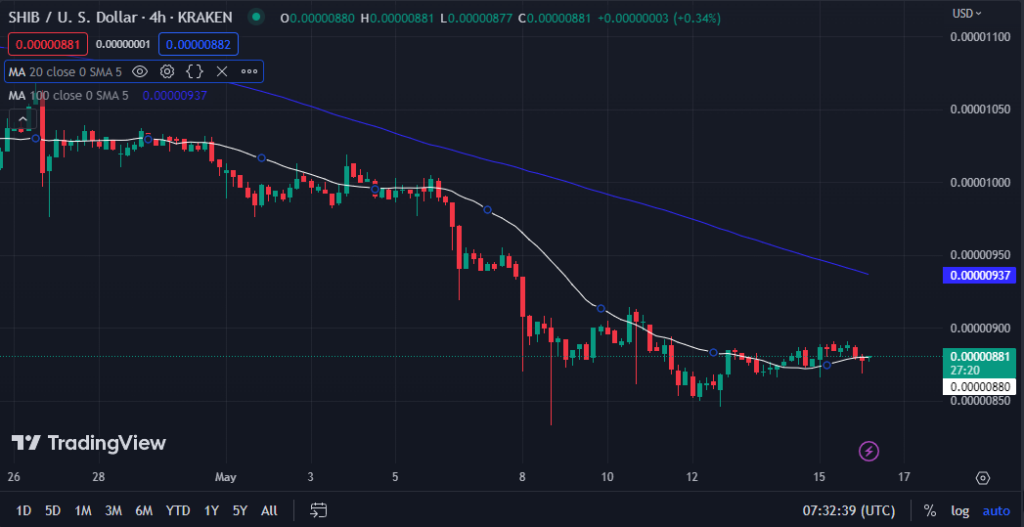
The 20-day moving average (white) is below the 100-day moving average (blue) on the SHIB/USD 4-hour chart, with the former at $0.00000880 and the latter at $0.00000937. This movement of the moving averages indicates that the SHIB market is experiencing significant negative momentum, and the bears may continue to dominate unless the bulls intervene.
The current price of SHIB/USD has passed above the 20-day MA while producing green candlesticks, indicating that the negative momentum is diminishing and a positive reversal is possible. Crossing over the 20-day moving average and forming green candlesticks suggest buyers are entering the market and driving the price upward.
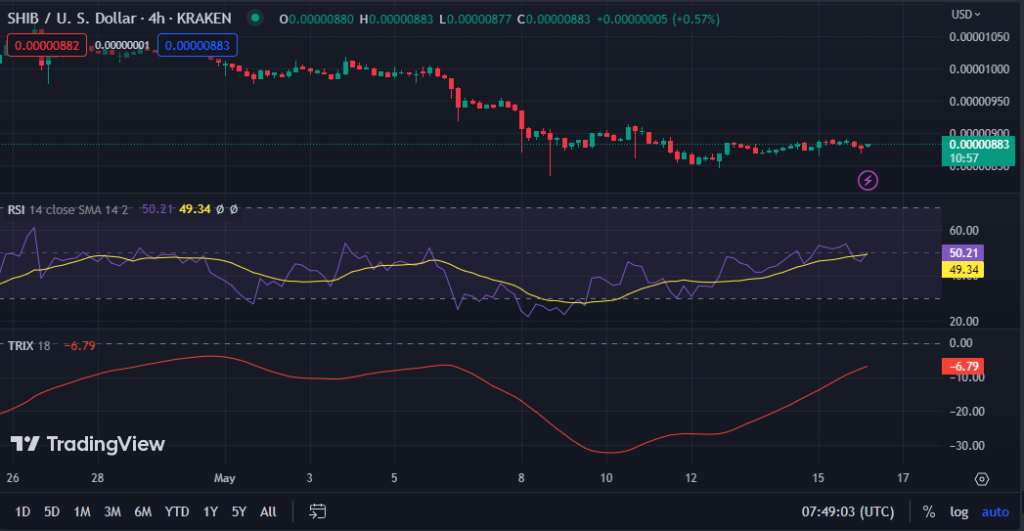
With a value of 50.21, the Relative Strength Index (RSI) has lately climbed above its signal line, indicating that the market’s negative momentum may be fading.
This RSI movement signals the market’s increasing purchasing pressure as investors restore confidence ahead of a possible upswing.
The direction of its line determines the trend of TRIX. If the TRIX line moves upward, the asset’s price momentum increases and the trend is bullish. If, on the other hand, the TRIX line moves downward, it indicates that the asset’s price momentum is decreasing and the trend is bearish.
As a result, with a TRIX reading of -6.79 and rising, negative pressure in SHIB is beginning to ease, indicating that the market is turning around. If the TRIX enters positive territory, it could indicate a bullish trend and attract more buyers to the market.
Despite recent setbacks, the SHIB market may be turning around as positive momentum builds and buyers enter the market.
Disclaimer: The views, opinions, and information shared in this price prediction are published in good faith. Readers must do their research and due diligence. Any action taken by the reader is strictly at their own risk. Coin Edition and its affiliates will not be liable for direct or indirect damage or loss.
Disclaimer: The information presented in this article is for informational and educational purposes only. The article does not constitute financial advice or advice of any kind. Coin Edition is not responsible for any losses incurred as a result of the utilization of content, products, or services mentioned. Readers are advised to exercise caution before taking any action related to the company.


