


- ADA market shows consolidation and potential buying opportunities.
- The Bullish momentum is rising as ADA’s price rebounds from the 7-day low.
- Additionally, positive indicators suggest ADA’s recovery from a recent drop.
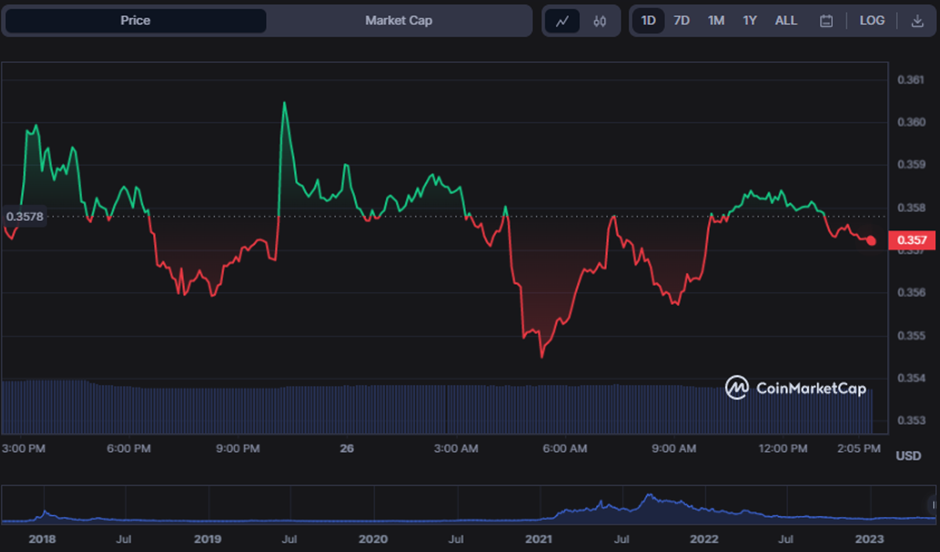
Despite efforts by bulls to push the price of Cardano (ADA) to new highs, bears have got the upper hand in the previous 24 hours. Consequently, the price of ADA has fluctuated between a 7-day low of $0.3545 and a 24-hour high of $0.3605.
ADA was trading at $0.3573 at the time of publication, down 0.22% from the previous close.
During the drop, ADA’s market capitalization and 24-hour trading decreased by 0.27% and 14.60%, respectively, to $12,460,391,478 and $146,070,191. This drop underscores traders’ concern about a long bear rally and market instability.
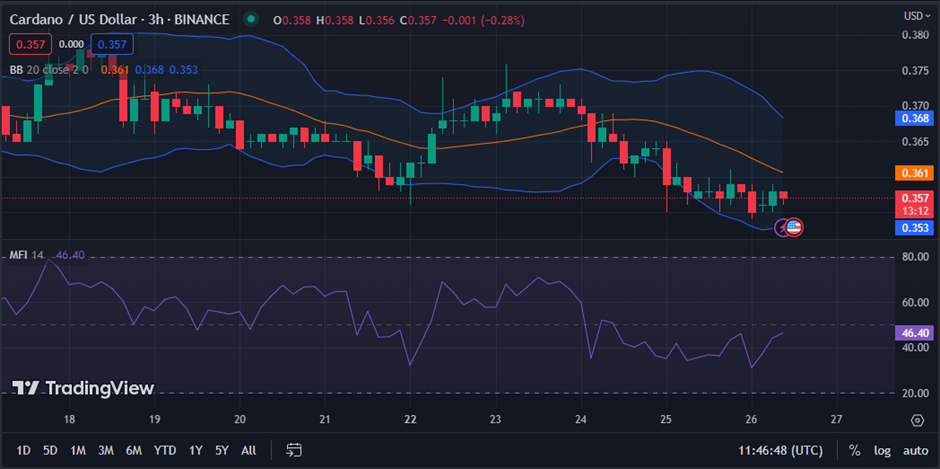
On the ADA 3-hour price chart, the decreasing trading volume and converging Bollinger bands indicate that the market is in a phase of consolidation.
Consolidation periods sometimes precede big market swings and may provide traders with a chance to acquire holdings at cheaper levels. Traders should consider purchasing at the lower end of the Bollinger bands and placing their stop loss.
With the Money Flow Index at 46.53 and trending higher, a bullish trend has the potential to develop. This expectation is based on the MFI level, which indicates that buying pressure is building and that ADA may rebound if bulls keep fighting.
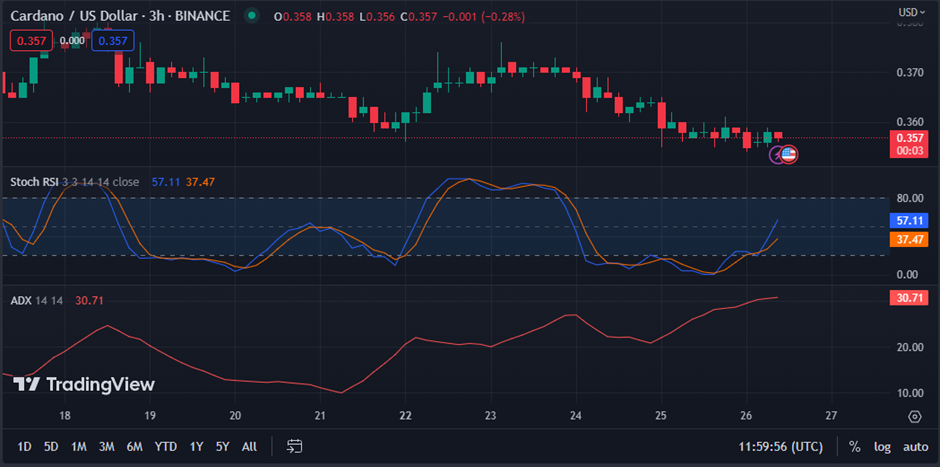
The negative hand in the ADA market is losing its grasp, with a stochastic RSI rating of 57.11 and going northward. This movement indicates a comeback as buying pressure rises and sellers lose control.
When the average directional indicator (ADX) is over 25, it indicates bullish momentum, and when it is below 20, it indicates bearish momentum. As a result, the ADX rating of 30.71 on the ADA price chart confirms this recovery hypothesis, suggesting a strongly rising trend.
Despite temporary bearish pressure, ADA’s consolidation phase and bullish indicators suggest a potential rebound, making it an opportune time for traders to consider acquiring holdings at lower levels.
Disclaimer: The views, opinions, and information shared in this price prediction are published in good faith. Readers must do their research and due diligence. Any action taken by the reader is strictly at their own risk. Coin Edition and its affiliates will not be liable for direct or indirect damage or loss.
Disclaimer: The information presented in this article is for informational and educational purposes only. The article does not constitute financial advice or advice of any kind. Coin Edition is not responsible for any losses incurred as a result of the utilization of content, products, or services mentioned. Readers are advised to exercise caution before taking any action related to the company.


