
- SHIB price struggles to break resistance, and bears take control.
- Negative momentum threatens to test the SHIB price support level.
- Indicators project buyers are gaining control, pointing to potential trend reversal for SHIB.
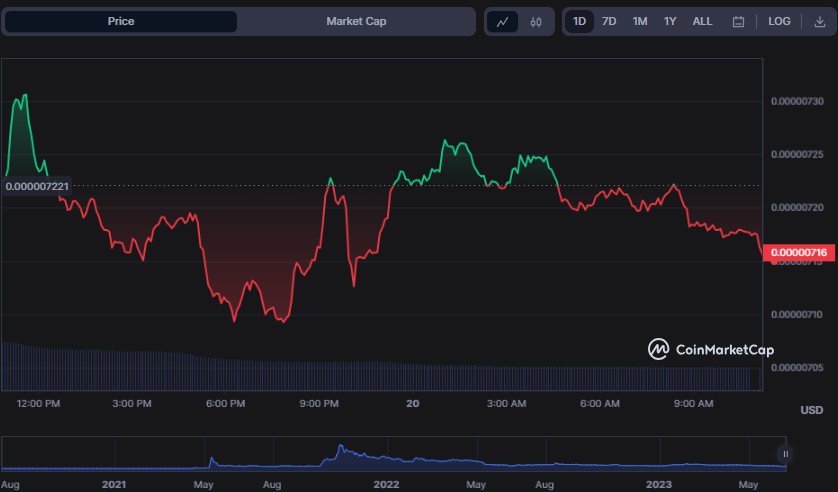
Despite a 19.73% rise in the 24-hour burn rate, positive momentum in the SHIB market dissipated after failing to breach the 24-hour high of $0.000007309. As a result, bears took control of the market, driving the SHIB price to an intra-day low of $0.000007071, where support was established.
The bearish influence was still in action at press time, resulting in a 1.69% drop to $0.000007164. During the bull-bear struggle, the SHIB’s market capitalization fell by 2.23% to $4,211,643,145, while the 24-hour trading volume fell by 52.14% to $97,529,107.
If negative momentum breaks through the $0.000007071 support level, the next possible support level is $0.000006900. However, if bulls take control, the SHIB price may test resistance levels around $0.000007500 and $0.000008000.
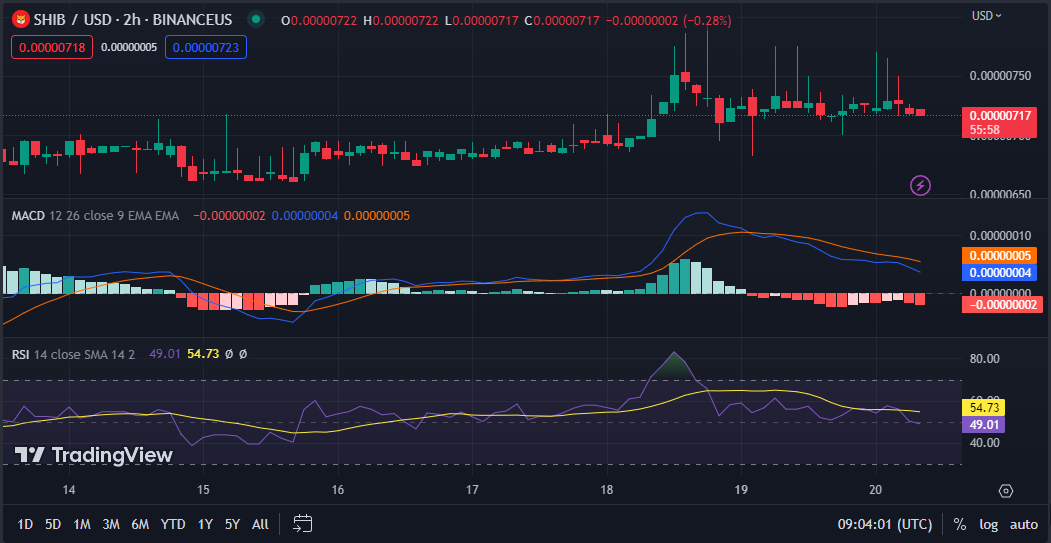
With a value of 0.00000004, the Moving Average Convergence Divergence (MACD) on the SHIBUSD 2-hour has moved below its signal line, indicates that bears are now in charge of the market. If the MACD line goes into negative territory, the price of SHIBUSD might fall further.
The histogram motion in the negative area adds to the bearish mood display, indicating that selling pressure intensifies. The Relative Strength Index (RSI) rating of 49.01 and movement below its signal line reinforce this SHIBUSD’s pessimistic outlook.
However, if the RSI value falls below 30, it may indicate oversold conditions and a possible price comeback.
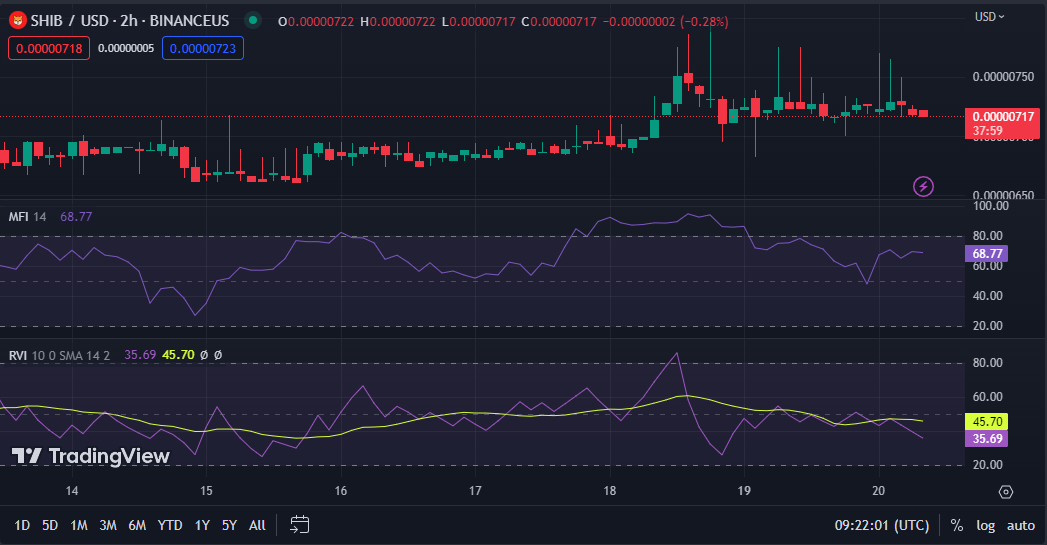
When the Money Flow Index rises over 50, there is more buying pressure than selling pressure; when it falls below 50, there is more selling pressure than buying pressure.
As a result, the SHIBUSD Money Flow Index rating of 68.77 indicates that the negative momentum in the SHIB market is fading. This level implies that buyers are gaining control, which might lead to a trend reversal.
With a score of 35.69, the Relative Volatility Index (RVI) is sliding below its signal line, reflecting the present slump in the SHIB market. However, there might be further downward volatility since the RVI is still over the oversold threshold 30.
If, on the other hand, the Relative Volatility Index reverses direction and goes above its signal line, it might indicate a shift in market mood and the beginning of a positive trend.
In conclusion, bearish pressure persists in the SHIB market as the price struggles to break resistance levels. However, indicators suggest a potential trend reversal as buyers gain control.
Disclaimer: The views, opinions, and information shared in this price prediction are published in good faith. Readers must do their research and due diligence. Any action taken by the reader is strictly at their own risk. Coin Edition and its affiliates will not be liable for direct or indirect damage or loss.
Disclaimer: The information presented in this article is for informational and educational purposes only. The article does not constitute financial advice or advice of any kind. Coin Edition is not responsible for any losses incurred as a result of the utilization of content, products, or services mentioned. Readers are advised to exercise caution before taking any action related to the company.


