


 Price Prediction 2024-2030: Will SHIB Price Hit $0.001 Soon?")
- Due to renewed market optimism, predictions suggest that SHIB may hit $0.000095 in 2025.
- SHIB might rebound to $0.00011285 in 2027 as anticipation builds for BTC’s 2028 halving.
- By 2040, SHIB could achieve $0.00100 if sustained development continues.
As the crypto market gears up for its next bull run, meme coins like Shiba Inu (SHIB) are at the forefront, sparking excitement and speculation. With increasing volatility and a reputation for massive price swings, SHIB has captivated investors and enthusiasts alike.
Currently, the sentiment around Shiba Inu is bullish, backed by technical indicators, while the Fear & Greed Index stands at a neutral 50. Over the past 30 days, SHIB has shown 17 out of 30 green days with price volatility of 4.06%, making its next moves particularly intriguing.
This raises the question: Is SHIB on the verge of skyrocketing to 1 cent? And if so, what does this mean for investors between now and 2030? Let’s dive into the Shiba Inu price predictions for 2024-2030 and uncover whether SHIB is on the path to making history—or if the hype will fizzle out. Will this meme coin rise to the occasion?
Table of contents
- What is Shiba Inu (SHIB)?
- Shiba Inu (SHIB) Market Status
- Shiba Inu (SHIB) Price Analysis
- Shiba Inu (SHIB) Price Prediction 2024
- Shiba Inu (SHIB) Price Prediction 2025
- Shiba Inu (SHIB) Price Prediction 2026
- Shiba Inu (SHIB) Price Prediction 2027
- Shiba Inu (SHIB) PricePrediction 2028
- Shiba Inu (SHIB) Price Prediction 2029
- Shiba Inu (SHIB) Price Prediction 2030
- Shiba Inu (SHIB) Price Prediction 2040
- FAQs
What is Shiba Inu (SHIB)?
Shiba Inu (SHIB) is a decentralized cryptocurrency that started in August 2020 as part of a growing meme coin trend. Created by an anonymous person under the pseudonym Ryoshi, SHIB was designed to compete with Dogecoin while offering a unique ecosystem.
Despite its origins as a joke, SHIB quickly gained popularity, thanks to its strong community and a passionate social media following known as the “SHIB Army.” Unlike many meme coins, Shiba Inu has developed its decentralized exchange called ShibaSwap, adding real functionality to the token.
Through ShibaSwap, users can stake their SHIB tokens, trade, and even earn rewards in other native tokens like LEASH and BONE. This ecosystem gives SHIB the potential to become much more than just a fleeting trend in cryptocurrencies. Additionally, the Shiba Inu project has embraced charitable donations and social good, setting it apart from other meme coins that lack such purpose.
With a supply of one quadrillion tokens and ambitious goals for future developments, SHIB continues to evolve, sparking curiosity about its potential to achieve long-term success. Could SHIB surprise us all? Time will tell.
Shiba Inu (SHIB) Market Status
The SHIB token has been on a roller coaster ride over the past month, with its price fluctuating widly. According to CoinMarketCap’s data, the bears had the upper hand at the beginning of the month, causing SHIB’s price to drop significantly.
During this period, Shiba Inu recorded a low of $0.00001244 before the bulls took over and pushed the price back up to $0.000014, where it settled for some time. As the bullish sentiment strengthened, SHIB’s price gradually climbed to the $0.000019 peak.
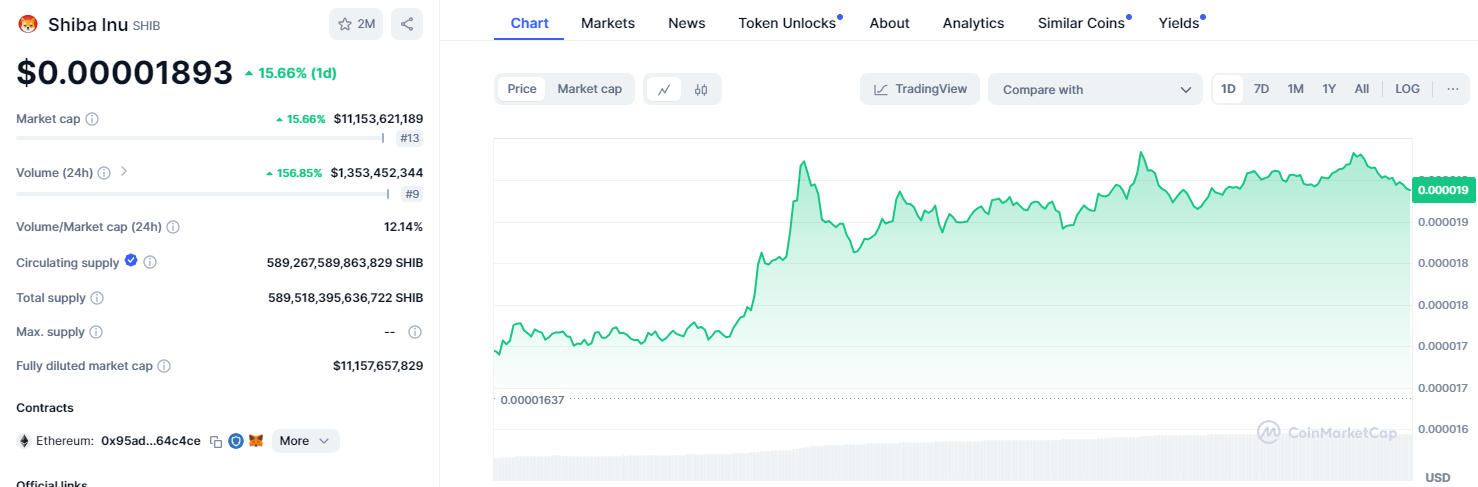
Source: CoinMarketCap
This data has further been mirrored on the weekly and daily charts, indicating a strong trend reversal in favor of the bulls. As of press time, the value of the SHIB token trades at $0.00001893, marking a 15.66% uptick compared to its previous day’s price.
Posited as the 13th most prominent cryptocurrency in market rankings, the asset’s intraday market cap currently stands at $11.153 billion. In comparison, its trading volume sits at $1.353 billion, reflecting a massive gain of 156.85% within the same time.
Shiba Inu (SHIB) Price Analysis
With a circulating supply of approximately 589.27 trillion SHIB out of a total supply of 589.51 trillion, Shiba Inu has caught the eye of many investors, signaling a potential for further growth. In this exploration, CoinEdition dives into real-time data and key market indicators to offer insights into SHIB’s price analysis and possible trends in the coming years.
Shiba Inu (SHIB) Price Analysis – Bollinger Bands
The Shiba Inu’s weekly Bollinger Bands indicate that bullish momentum is brewing, with the upper band remaining stable and the lower band converging toward the price line. This suggests that SHIB may experience continued upward price movement in the short term, with the potential of a price consolidation looming.
Currently, SHIB has surged past the middle band at around $0.00001744 and is showing signs of solid support at this level. If SHIB can maintain this level in the near future, it could witness its price challenge to the upper band, around the 23.60% Fibonacci level at the $0.00002539 level.
Conversely, a shift in momentum could result in a pullback, possibly retesting the lower band at $0.00000949.
Shiba Inu (SHIB) Price Analysis – Relative Strength Index
Originating from the overbought conditions, the RSI shows that the SHIB token has been on a bearish sentiment in the long term. However, as the RSI nearly approached the oversold region, it reversed to the upside.
As of press time, the RSI line has broken above the neutral 50 level, a signal that bullish momentum is gaining strength. Positioned at 55.75 and upwards, the RSI suggests ample space for upward movement before overbought regions are reached.
Such a scenario might push the memecoin to challenge its immediate resistance at the $0.00002582 zone.
Shiba Inu (SHIB) Price Analysis – Moving Average Convergence Divergence
On the same accord, the MACD indicator reveals a strengthening bullish trend, with the MACD line at -0.00000097 on the verge of crossing above the signal line. Moreover, the MACD’s histogram chart shows its red bars flattening around the zero line, indicating a potential shift toward positive momentum.
If this event persists in the short term, SHIB might surge toward the $0.00002582 resistance level, with the potential to break out and establish a new higher high. However, a shift in market sentiment or a lack of buying pressure could lead to a retest of support at $0.000010 before attempting another bullish move.
Shiba Inu (SHIB) Price Prediction 2024
In the current DMI readings, the +DI stands at 28.5990, indicating stronger upward momentum compared to the -DI at 21.1644, which represents bearish pressure. This suggests that the bulls currently have the upper hand in the market.
However, the ADX is at 19.3749, a value below 25, signaling a relatively weak trend despite the bullish advantage. This implies that while buyers are in control, the market trend itself lacks strong momentum. A higher ADX reading would suggest a more definitive trend direction.
Given these market conditions, the SHIB token is anticipated to challenge this year’s high at the $0.00004575 threshold, with the potential to surpass it and peak around $0.00004800. Contrastingly, a market correction could pull SHIB’s price back to support levels around $0.000060 before potentially resuming an upward trend.
Shiba Inu (SHIB) Price Prediction 2025
Per Coin Edition’s projections, SHIB could surpass its all-time high and peak at $0.000095, driven by BTC’s 2024 halving effect and renewed market optimism. A market correction could drop SHIB to $0.00004575 due to profit-taking and waning momentum post-bull run.
Shiba Inu (SHIB) Price Prediction 2026
According to our forecast, a bearish turn could pull SHIB to $0.00002582 as crypto enthusiasm declines, influenced by fading BTC halving hype and market consolidation. Conversely, the token might reach $0.00007202 amid sustained investor interest.
Shiba Inu (SHIB) Price Prediction 2027
Coin Edition suggests SHIB could rebound to $0.00011285 as anticipation for BTC’s 2028 halving builds. On the downside, low market participation and external economic factors might cause SHIB to drop to $0.00004800 during the bearish phases.
Shiba Inu (SHIB) PricePrediction 2028
Per Coin Edition, SHIB could peak at $0.00014191 due to strong community support and the next BTC halving. However, if investors grow cautious after the halving, a potential pullback to $0.00007500 might occur.
Shiba Inu (SHIB) Price Prediction 2029
Coin Edition forecasts SHIB could soar to $0.00020878, fueled by community-driven initiatives and market expansion. A drop to $0.00012478 is possible if the crypto market undergoes a correction or liquidity diminishes.
Shiba Inu (SHIB) Price Prediction 2030
Coin Edition estimates that the SHIB price could drop to $ 0.00005791 due to market saturation or regulatory pressures. Nevertheless, it could hit a high of $0.00013527, buoyed by its established ecosystem and growing global adoption.
Shiba Inu (SHIB) Price Prediction 2040
According to Coin Edition, SHIB might achieve a high of $0.00100 with decades of sustained development and a massive global user base. A crash to $0.00050 could result from technological obsolescence or overwhelming competition in the crypto space.
FAQs
Shiba Inu (SHIB) is a decentralized cryptocurrency created as a “Dogecoin Killer.” It runs on the Ethereum blockchain and supports smart contracts, enabling decentralized apps (DApps).
You can buy SHIB on popular exchanges like Binance, Coinbase, and ShibaSwap. You must create an account, deposit funds, and exchange them for SHIB.
SHIB is a speculative investment. Its ample supply and volatile price make it risky, but it has a strong community and an evolving ecosystem that includes staking and trading.
Shiba Inu (SHIB) reached its all-time high of $0.00008845 on October 28, 2021, driven by strong community support and social media hype.
According to our price forecast, SHIB could reach the $0.001 level by 2040, influenced by a massive global user base.
Shiba Inu (SHIB) has a circulating supply of approximately 589.27 trillion tokens out of 589.51 trillion.
Shiba Inu’s SHIB is anticipated to surpass its all-time high in 2025, potentially reaching around $0.000095.
Shiba Inu’s (SHIB) lowest recorded price is $0.000000000056, shortly after its launch in 2020, before gaining popularity and increasing in value.
Shiba Inu (SHIB) was created by an anonymous person or group using the pseudonym “Ryoshi.”
Shiba Inu (SHIB) was launched in August 2020 as part of the meme coin trend, gaining popularity due to its community and marketing efforts.
You can store Shiba Inu (SHIB) in a variety of cryptocurrency wallets, including hardware wallets like Ledger and Trezor or software wallets like MetaMask and Trust Wallet.
In 2024, SHIB is projected to peak around $0.00004800, driven by market momentum post-BTC halving, with a possible low of $0.000020 due to market corrections.
Shiba Inu could reach a high of $0.000095 in 2025, driven by post-halving market optimism, while a possible low of $0.00004575 may occur due to profit-taking and reduced momentum.
In 2026, SHIB may hit $0.00007202, supported by steady interest, but a correction could see it fall to $0.00002582 as BTC halving hype fades.
Shiba Inu could peak at $0.00011285 in 2027 due to pre-BTC halving anticipation, while the lowest potential price is $0.00004800 amid market slowdowns.
Shiba Inu may reach $0.00014191 in 2028, supported by strong community backing during the BTC halving, with a low of $0.00007500 due to cautious post-halving sentiment.
By 2029, SHIB could hit a high of $0.00020878, driven by community and market growth, while a possible low of $0.00012478 may occur amid corrections or liquidity issues.
Shiba Inu may rise to $0.00013527 in 2030, fueled by adoption, but it could dip to $0.00005791 due to regulatory pressures or market saturation.
In 2040, Shiba Inu could reach $0.00100, supported by decades of development, though it could fall to $0.000050 due to competition or technological obsolescence.
Disclaimer: The information presented in this article is for informational and educational purposes only. The article does not constitute financial advice or advice of any kind. Coin Edition is not responsible for any losses incurred as a result of the utilization of content, products, or services mentioned. Readers are advised to exercise caution before taking any action related to the company.
 Price Prediction 2026, 2027, 2028, 2029, 2030-2050")


