


- FTM’s bullish run falters as SpiritSwap closure triggers caution.
- The RSI and MACD trends signal a potential short-term downside for FTM.
- Oversold Stochastic RSI hints at FTM price reversal risk loom.
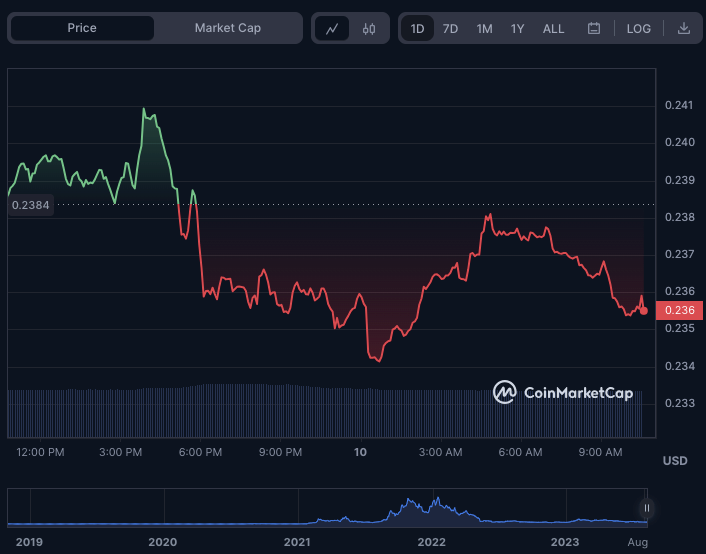
Bullish momentum in the Fantom (FTM) market has waned as bulls paused due to resistance at the intraday high of $0.241. This pessimism is fueled, in part, by the closure of SpiritSwap, a decentralized exchange (DEX) based on the Fantom Opera Chain.
As a result, bears drove the FTM price down to a 24-hour low of $0.234 before finding support. FTM was trading at $0.2355 at the time of publication, with a slight recovery as buyers stepped in to take advantage of the dip.
During the period of pessimism, FTM’s market capitalization and 24-hour trading volume fell by 1.29% and 2.32%, respectively, to $659,867,741 and $41,715,073. This drop in market capitalization and trading volume reflects investors’ and traders’ cautious reaction to the DEX’s closure.
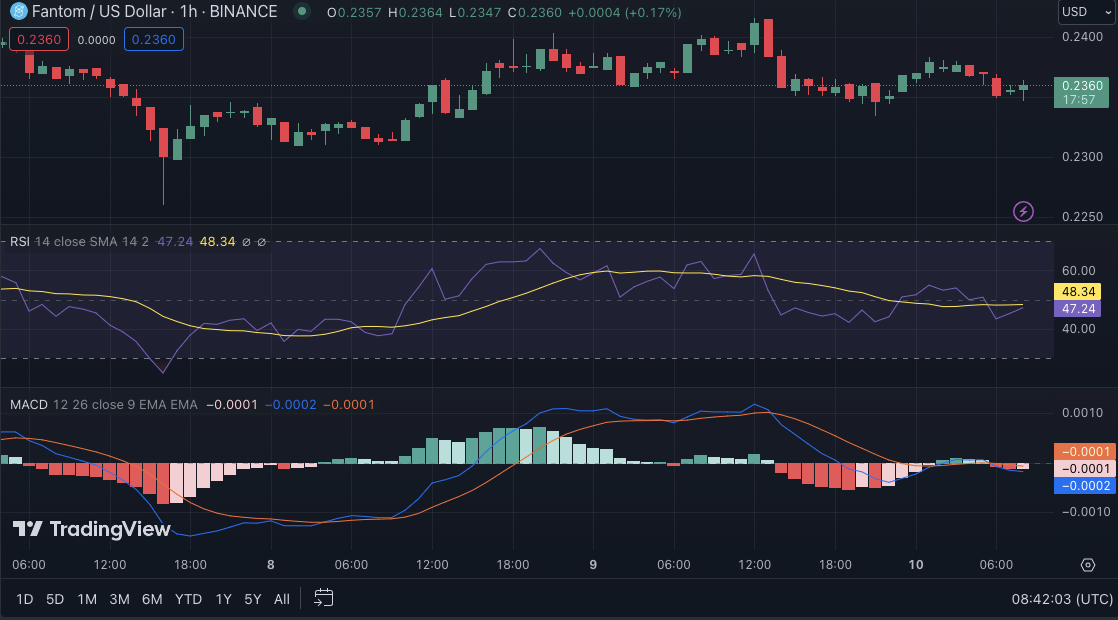
With the Relative Strength Index (RSI) moving south and below its signal line on the FTMUSD 1-hour price chart at 42.98, it suggests that FTM may have more downside potential in the short term. However, if the RSI begins to reverse and rise above its signal line, it may indicate a possible shift in sentiment and a buying opportunity for traders.
Furthermore, with a reading of -0.002, the Moving Average Convergence Divergence (MACD) has moved into the negative region, indicating a bearish trend for FTMUSD. Additionally, the MACD histogram forms red bars, indicating that momentum is shifting to the downside. This move adds to the bearish outlook for FTMUSD and indicates that traders should proceed with caution when considering a potential buying opportunity.
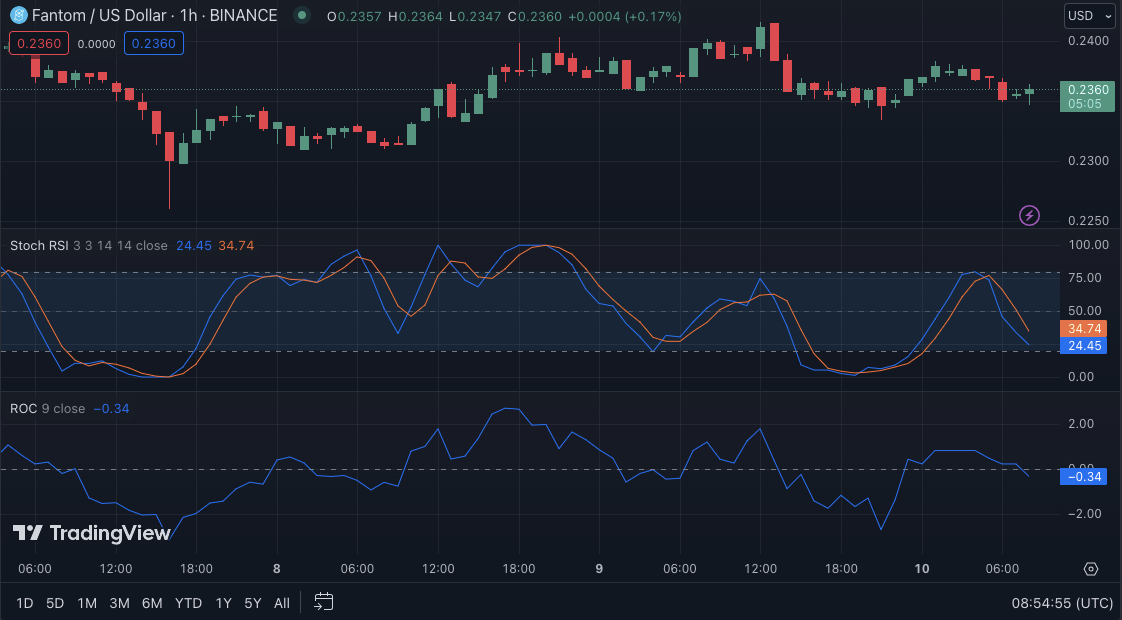
However, the FTM price chart’s Stochastic RSI rating of 24.38 indicates an oversold condition. This level indicates that selling pressure has reached an extreme and that a possible reversal or consolidation is on the horizon.
The recent shift in the Rate of Change (ROC) trend into negative territory, with a reading of -0.34, adds to the bearish sentiment for FTMUSD.
This trajectory indicates that the price has been falling faster recently, indicating further downside. Furthermore, the declining volume on the FTMUSD chart indicates a lack of buying interest, possibly contributing to further price declines soon.
In conclusion, FTM faces cautious headwinds post-DEX closure. Technicals hint at short-term caution, but oversold conditions may spark a turnaround.
Disclaimer: The views, opinions, and information shared in this price prediction are published in good faith. Readers must do their research and due diligence. Any action taken by the reader is strictly at their own risk. Coin Edition and its affiliates will not be liable for direct or indirect damage or loss.
Disclaimer: The information presented in this article is for informational and educational purposes only. The article does not constitute financial advice or advice of any kind. Coin Edition is not responsible for any losses incurred as a result of the utilization of content, products, or services mentioned. Readers are advised to exercise caution before taking any action related to the company.
 Price Prediction 2026-2030: Will TRX Hit $0.50 Soon?")
 Price Prediction 2026-2050: Will HYPE Hit $100 Soon?")


: What Happens If You Use an Unlicensed Platform?")