


- SUI/USD faces resistance at $1.31, with a potential drop to $1.00.
- Fisher Transform signals a downward trend, presenting a selling opportunity.
- Traders should consider waiting for a trend reversal before opening a long position in SUI.
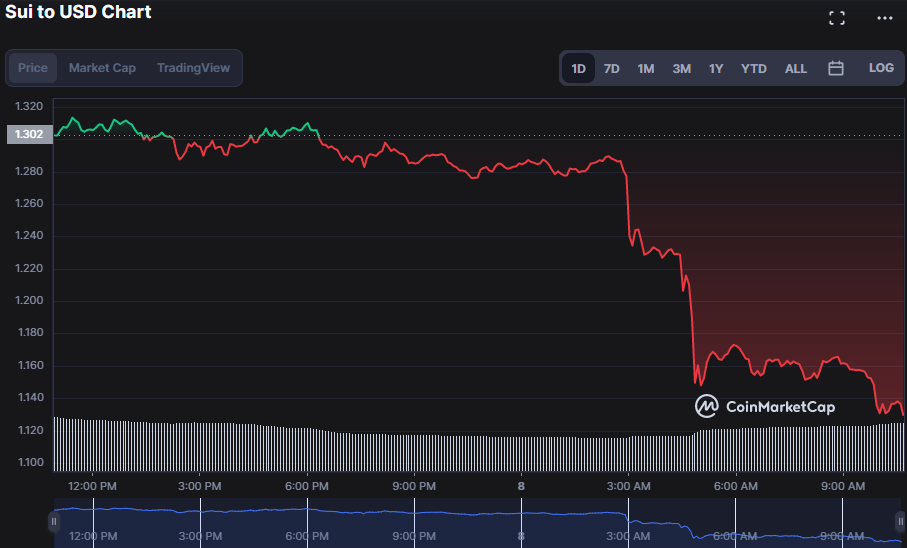
Early in the day, bulls in Sui (SUI) were victorious but ran into significant resistance at $1.31. Due to the resistance, the SUI market became bearish, and the price plummeted to a 24-hour low of $1.13 as of press time, a 12.95% drop.
If the bears break the $1.13 support level, the next level to monitor is $1.00. This price drop might be related to profit-taking by investors who purchased SUI at a lower price and are now cashing out.
During the downturn, SUI’s market capitalization and 24-hour trading volume plummeted by 13.49% and 6.60%, respectively, to $597,521,649 and $373,553,888. The drop shows that investors may be cautious and liquidating their SUI holdings.
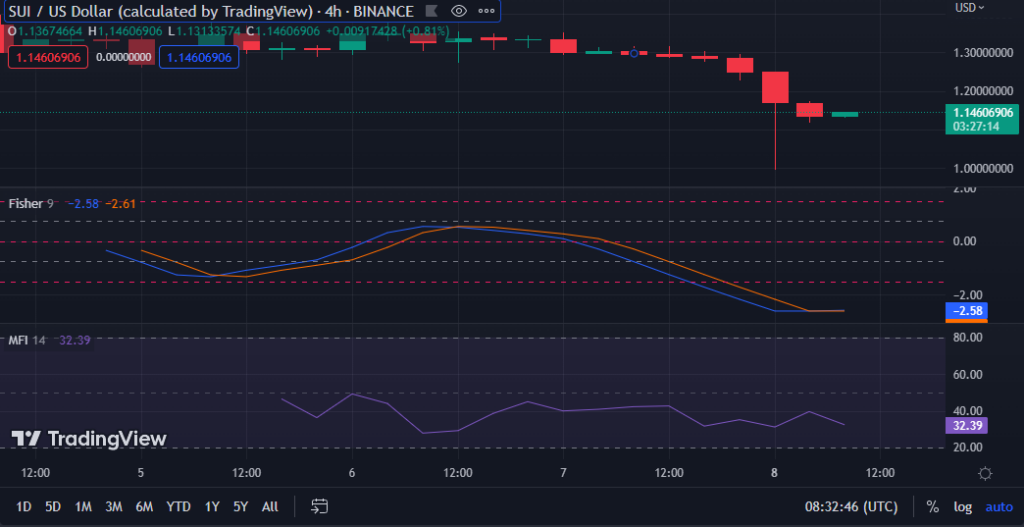
With a reading of -2.61, the Fisher Transform movement indicates that the price of SUI/USD is likely to continue its downward trend, signaling a possible selling opportunity for traders.
Due to this trend, traders may consider selling or waiting for a clear reversal signal before opening a long position.
The negative trend in SUI may continue, with a Money Flow Index rating of 32.45 going south. A rating of less than 50 suggests that selling pressure may dominate purchasing demand, leading to a further price decline hence the bearish anticipation.
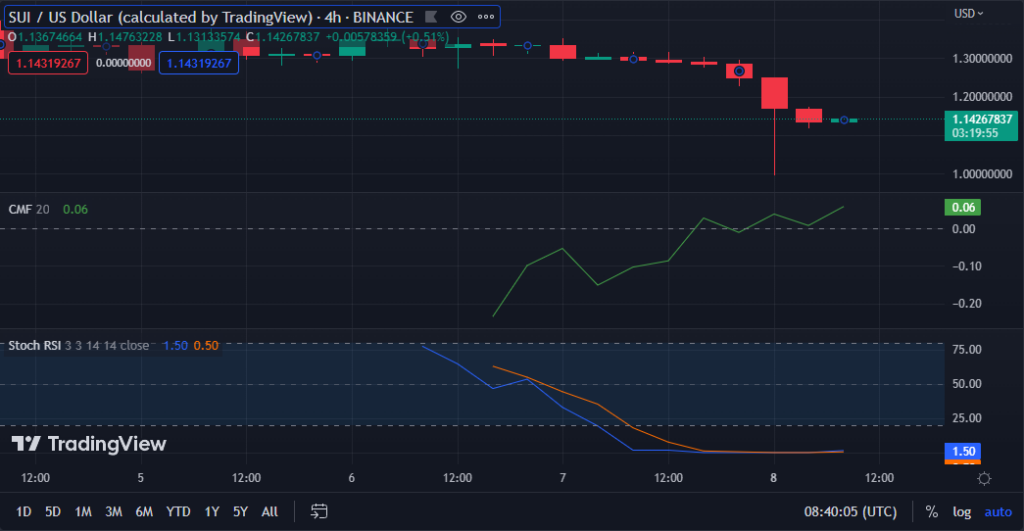
Despite the SUI market being in negative territory, the Chaikin Money Flow (CMF) pointing upwards in a positive area with a value of 0.06 shows that there is still some purchasing pressure in the market.
This implies that traders should wait for a definite trend reversal before contemplating a purchasing opportunity since the present positive action might just be a market correction.
On the SUI/USD price chart, the Stochastic RSI value of 1.50 suggests that the market is oversold, with significant selling and low buying pressure. Although the negative momentum may persist, a trend reversal is probable if the Stochastic RSI rises above the oversold level of 20.
In conclusion, SUI faces selling pressure but may present a buying opportunity soon as indicators reflect market is oversold.
Disclaimer: The views, opinions, and information shared in this price prediction are published in good faith. Readers must do their research and due diligence. Any action taken by the reader is strictly at their own risk. Coin Edition and its affiliates will not be liable for direct or indirect damage or loss.
Disclaimer: The information presented in this article is for informational and educational purposes only. The article does not constitute financial advice or advice of any kind. Coin Edition is not responsible for any losses incurred as a result of the utilization of content, products, or services mentioned. Readers are advised to exercise caution before taking any action related to the company.

 Price Prediction 2026, 2027, 2028, 2029, 2030-2050")


