


- Bears take control of the 24-hour price chart.
- A further decline could happen if bears surpass the $32.41 support level.
- Bulls are in control on the four-hour chart.
Compound price analysis indicates that the price of COMP/USD has been declining and that there has been a minor downward trend for the cryptocurrency. Over the previous week, COMP/USD dropped from a high of $33.61 to a low of $31.82.
However, after a few days, the bulls started to signal, and the price rose to $32.70. Since COMP/USD is now heading lower, traders should watch for a break of the $32.41 support level.
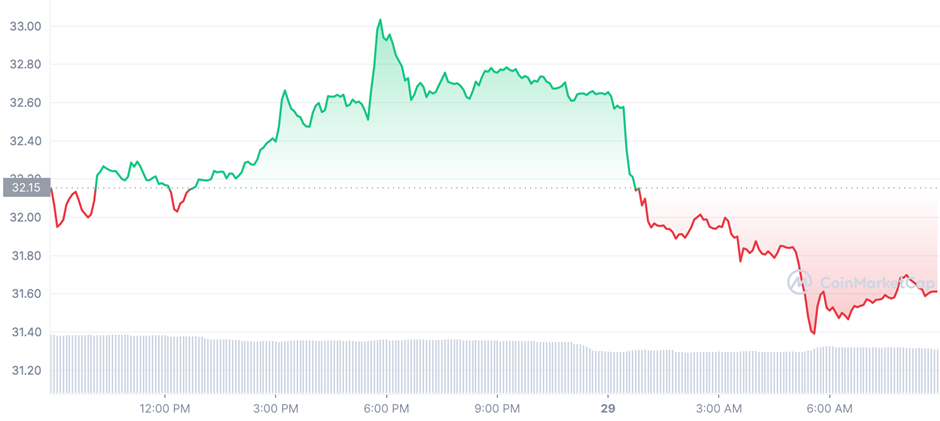
The fact that Compound’s 24-hour trading volume fell by 25.07% to $13,024,488 while its market capitalization decreased by 1.42% to $230,134,770 is proof of the significant market volatility.
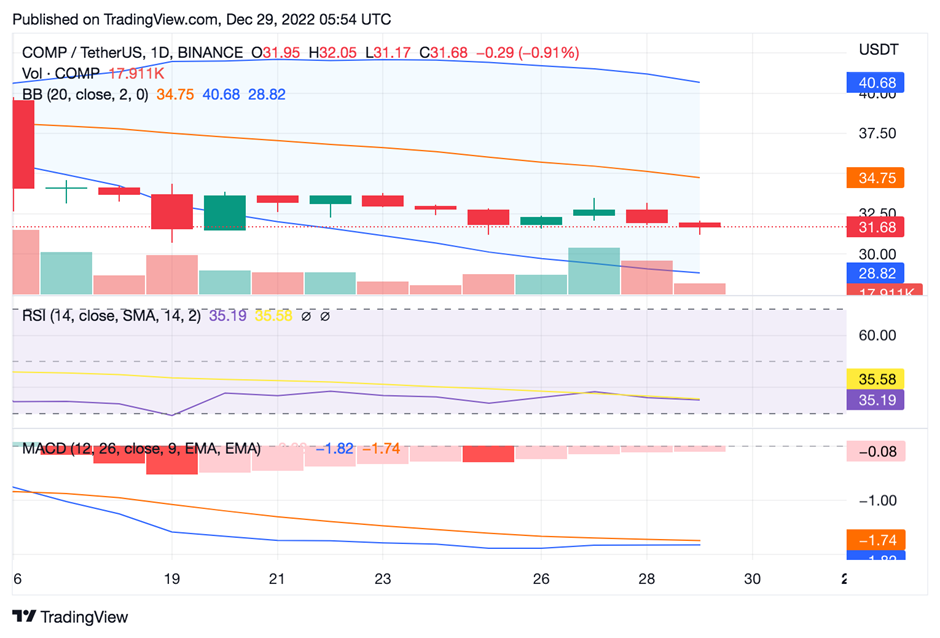
Given that the Moving Average Convergence Divergence (MACD) line is below the signal line, the bearish attitude in the Compound market may continue in the next hours. Therefore, before joining the Compound market, traders and investors should act with the utmost prudence. The development of a negative trajectory histogram indicates that the Compound market may continue to experience bearish strength for some time.
The relative strength indicator (RSI) for COMP is currently at 35.19, which suggests that a bearish divergence is about to occur. As the RSI line crosses below the signal line, the COMP market shows signs of weakening.
The 20-day exponential moving average (EMA), currently holding steady at $32.1, points to a potential bounce off this level in the coming hours. If COMP successfully breaks through and maintains above the $33.03 resistance level, it may continue to rise towards $34. However, if it cannot surpass this resistance level, a slight retracement may be witnessed in the next hours.
On the 1-day chart, COMP is building a bullish flag formation based on further technical indicators. The breakthrough from this trend might indicate additional price growth for COMP. If COMP successfully breaks through the $33 resistance level, a bullish reversal on the RSI may also be observed.
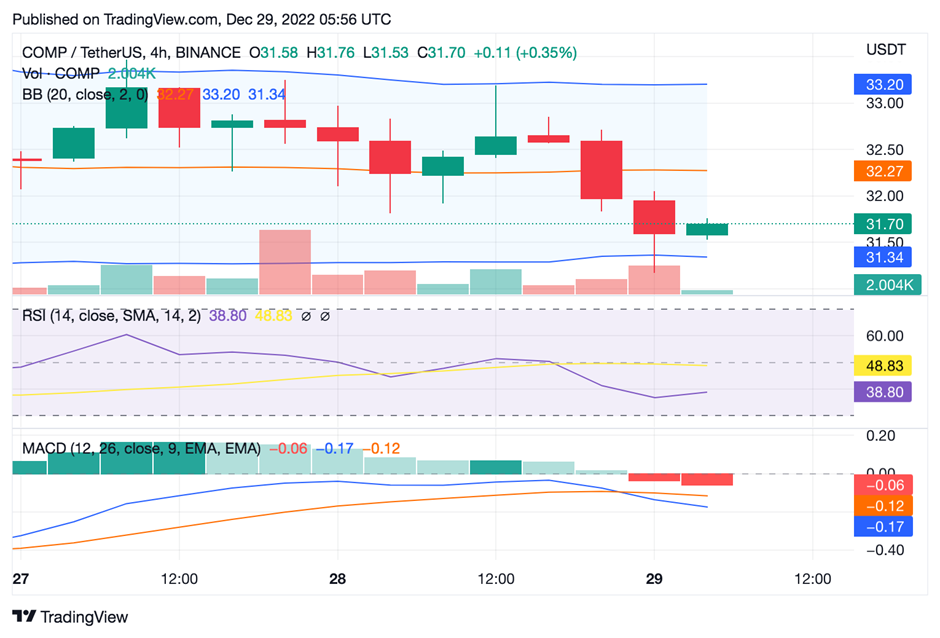
On the four-hour chart, the Bulls have started showing signs of gains. The bulls are trying to reverse the bearish state of the market to a positive one in the short term.
Despite the short-term bulls’ attempts to reverse the market trend, COMP’s bearish trend may persist if the bears successfully break through the barrier level.
Disclaimer: The views and opinions, as well as all the information shared in this price analysis, are published in good faith. Readers must do their own research and due diligence. Any action taken by the reader is strictly at their own risk, Coin Edition and its affiliates will not be held liable for any direct or indirect damage or loss
Disclaimer: The information presented in this article is for informational and educational purposes only. The article does not constitute financial advice or advice of any kind. Coin Edition is not responsible for any losses incurred as a result of the utilization of content, products, or services mentioned. Readers are advised to exercise caution before taking any action related to the company.
: What Happens If You Use an Unlicensed Platform?")


