


 Bulls as Prices Dip by 0.07%")
- In the last 24 hours, AVAX price has been following a descending trend.
- Bearish sentiment may persist AVAX market as indicated by technical indicators.
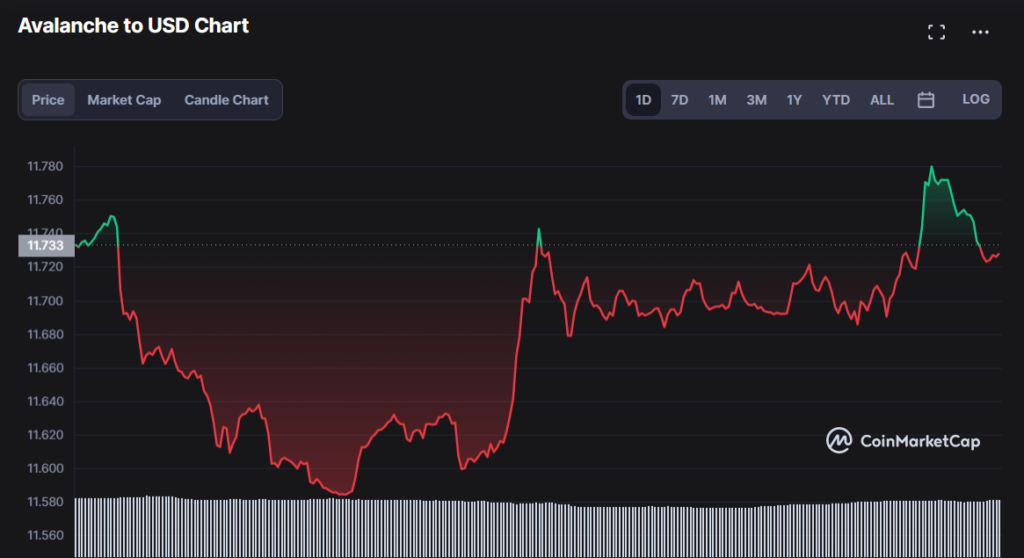
- Avalanche has a support at $11.58 and a resistance at $11.78.
Avalanche’s (AVAX) opening price was $11.73, with bulls holding a slight edge. Although this was the case initially, the AVAX price movement was altered as a result of bear market intervention. After that point, AVAX found support at $11.58 and resistance at $11.78 as the bears took over the market.
AVAX has seen a price drop of 0.07% over the past 24 hours and is now trading at $11.73. Both the market capitalization (down 0.07% to $3,651,771,677) and the trading volume (down 2.89% to $106,438,216) reflect the bearish sentiment. The current CoinMarketCap ranking is #18, with a live market cap of $3,654,402,786.
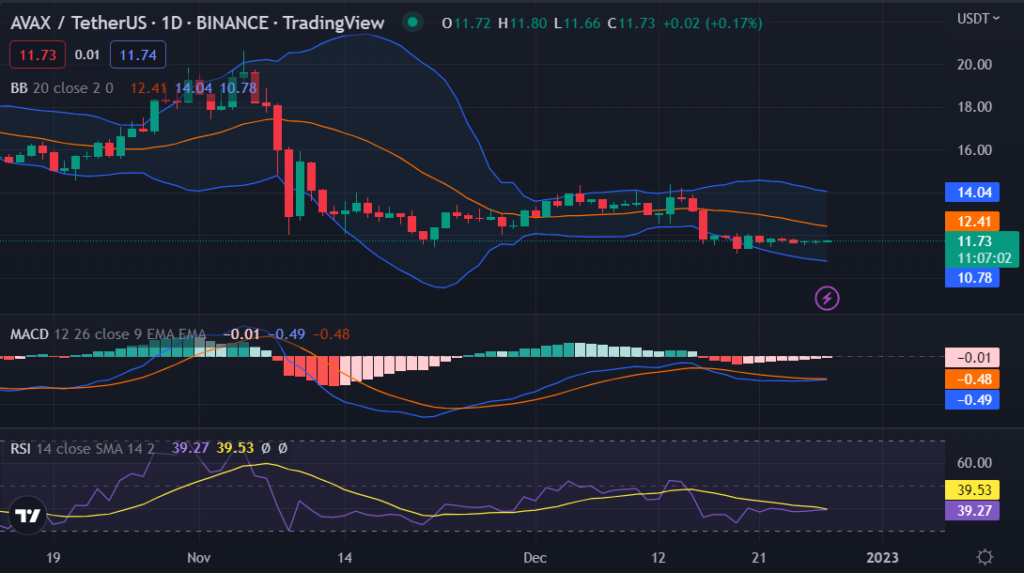
Bearish sentiment in the AVAX market may persist in the coming hours as the Moving Average Convergence Divergence (MACD) line is below the signal line. Therefore, traders and investors should proceed with extreme caution before entering the AVAX market. The formation of a negative trajectory histogram suggests that this bearish strength may persist in the AVAX market for the foreseeable future.
The Relative Strength Index (RSI) line is currently at 39.59, indicating that the bearish trend in the market might continue. Investors are worried about the possibility of a bearish persistence as a result of the recent drop below its SMA line, which is adding to the negative trend that has been observed.
The contraction of the Bollinger Band (BB) indicator reveals that the AVAX market is currently characterized by a bearish sentiment. 10.78 is the lowest point that can be reached on the lower band, and 14.04 is the highest point that can be reached on the upper band. These levels act as a level of support and resistance for the AVAX price in the short term, respectively.
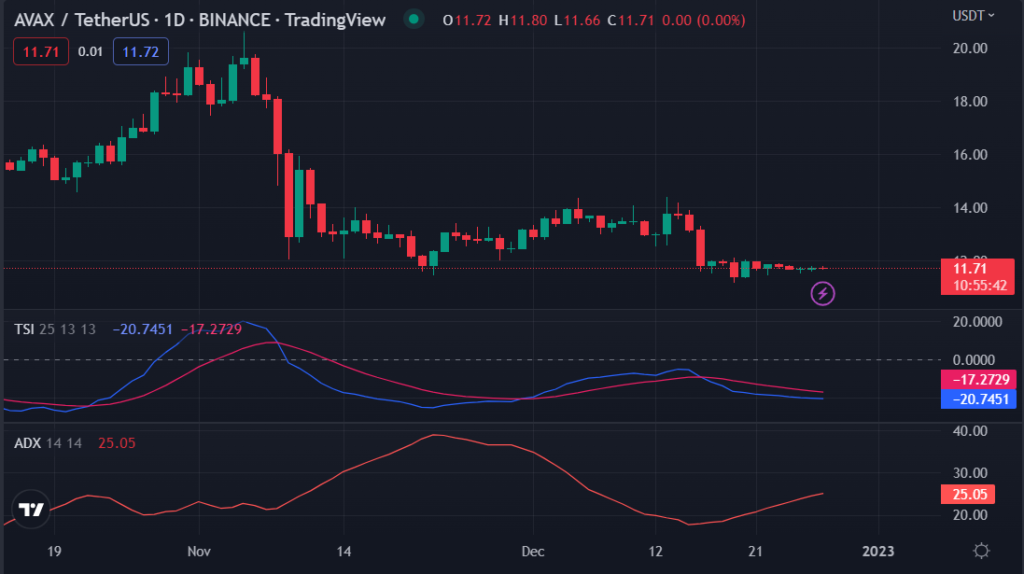
The ADX line is moving in an upward direction, which gives investors a bullish outlook on the market and indicates that bullish sentiment may be observed in the hours ahead if it continues to move in this direction. It is possible that AVAX will experience a price reversal in the coming hours due to the fact that it has reached the overbought region. This is the case despite the fact that ADX is currently issuing a warning to investors at the same time.
The True Strength Index (TSI) for the 24-hour price chart is located below the signal line with a reading of -20.7709, which indicates that the bearish sentiment is growing stronger and that this bearish movement might be experienced in the market in the near future.
Current AVAX price analysis indicates a downward trend in the AVAX price. The indicators suggest that this trend might continue for the next few hours.
Disclaimer: The views and opinions, as well as all the information shared in this price analysis, are published in good faith. Readers must do their own research and due diligence. Any action taken by the reader is strictly at their own risk, Coin Edition and its affiliates will not be held liable for any direct or indirect damage or loss.
Disclaimer: The information presented in this article is for informational and educational purposes only. The article does not constitute financial advice or advice of any kind. Coin Edition is not responsible for any losses incurred as a result of the utilization of content, products, or services mentioned. Readers are advised to exercise caution before taking any action related to the company.


