


- The DOGE price fell by 5.09% to $0.0737, giving the bears control of the market.
- Technical indicators that are pointing south indicate a further bearish trend.
- Analysis of the DOGE price reveals a gloomy market trend.
According to the daily price charts, Dogecoin (DOGE) has witnessed a dip that has resulted in a 5.09% decrease to its current value of $0.0737 after a brief bullish run.
DOGE has a market capitalization of $9,939,385,613 which is a 5.89% decline while the trading volume spikes by 28.68 to $2,405,381,588 in the last 24 hours.
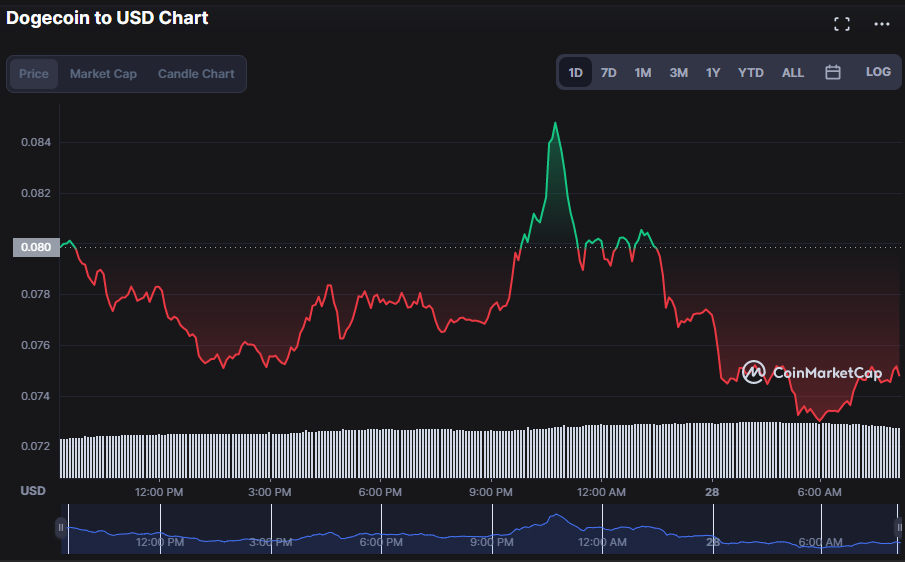
DOGE/USD 1-day price chart (Source:CoinMarketCap)On the DOGE price charts, Bollinger Bands are moving linearly, which indicates a stable market. The upper band and bottom band both touch at 0.08166 and 0.07193 respectively. This action suggests that the market may continue its current momentum.
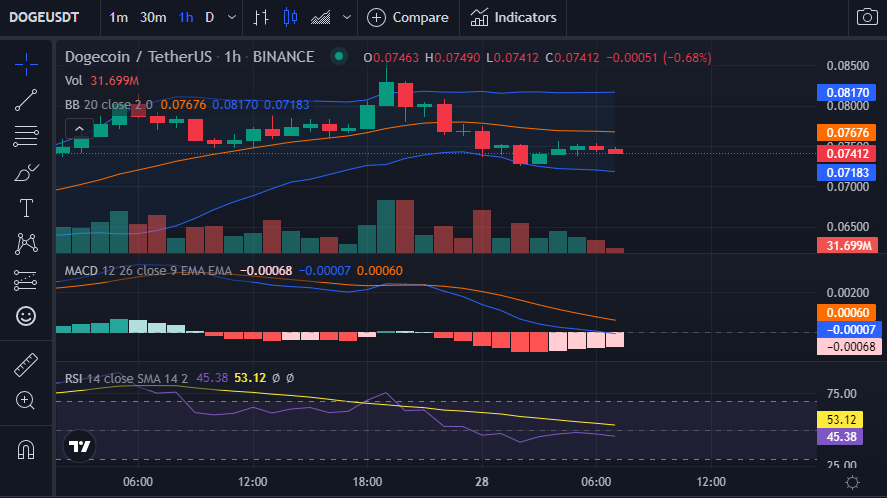
On the 1-hour price chart, the Moving Average Convergence Divergence (MACD) is pointing south and moving below the signal line. 0.00061 is the reading on the signal line, whereas -0.00002 is the MACD reading. The histogram’s position in the negative region is another element bolstering this bearish trend.
Relative Strength Index recently crossed into the overbought zone, however, it is currently reading 47.44. When existing investors began to panic because the price of DOGE was moving too quickly, prices started to revert lower as indicated by the RSI action.
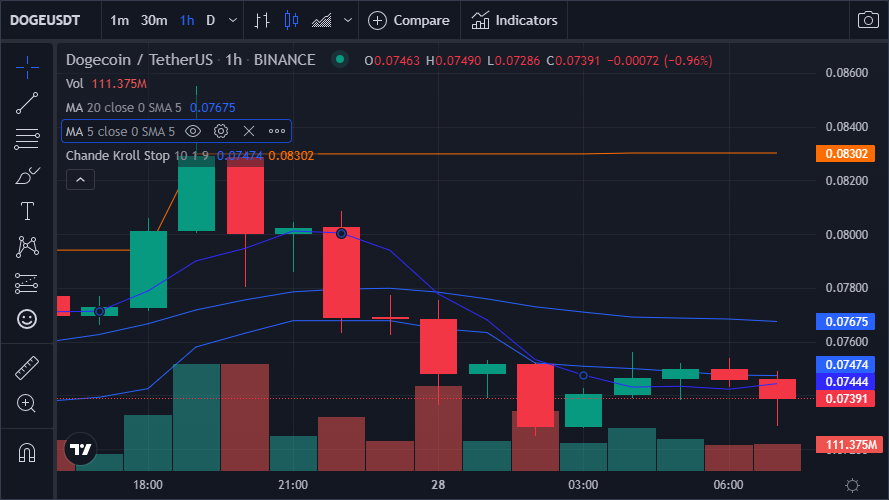
DOGE/USD 1-hour price chart (Source: CoinMarketCap)A bearish crossover is indicated when the short-term MA crosses below the long-term MA. The 20-MA touches at 0.07672, while the 5-day MA touches at 0.07430. Additionally, the market’s current price is below both MA, which indicates a continuing decline.
The signal line has a reading of 0.08302, which is higher than the Chande Kroll Stop blue line, which has a reading of 0.07474. This action suggests that the market’s downward trend may continue.
The bulls must raise prices and maintain the resistance level in order to defy the bears’ dominance and stop the bearish momentum in the current market.
Disclaimer: The views and opinions, as well as all the information shared in this price analysis, are published in good faith. Readers must do their own research and due diligence. Any action taken by the reader is strictly at their own risk, Coin Edition and its affiliates will not be held liable for any direct or indirect damage or loss.
Disclaimer: The information presented in this article is for informational and educational purposes only. The article does not constitute financial advice or advice of any kind. Coin Edition is not responsible for any losses incurred as a result of the utilization of content, products, or services mentioned. Readers are advised to exercise caution before taking any action related to the company.
 Price Prediction 2026, 2027, 2028, 2029, 2030 -2050")


