


The crypto world has recently become the highlight as an after-effect of the various financial institutions’ crashes. While many digital coins are still waking up from their slumber, some cryptocurrencies have shown a remarkable performance over the week.
Read more to find out the best-performing tokens for this week and the reason behind their success.
Mask Network (MASK)
Ranking first as the top-performing coins, MASK is currently priced at $6.24 witnessing a massive surge of 45.56% in seven days. MASK has a market cap of $474,514,314 while experiencing a hike of 17.78% in one day. Meanwhile, the trading volume of MASK is valued at $360,773,409 with a sudden jump of 70% jump in 24 hours, which indicates that traders have a keen interest in this coin.
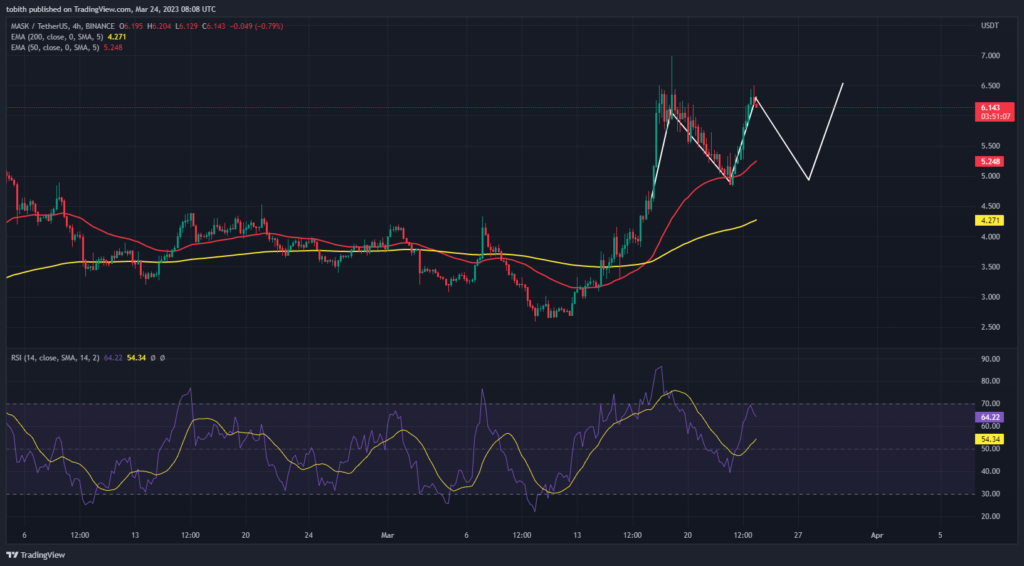
Looking at the 4-hour chart, MASK is currently riding with the bull as its candlesticks are above the EMA indicators. Moreover, the 50EMA and the 200EMA recently formed a golden cross, which signaled the start of the upward momentum. As more buyers entered the market, MASK’s rise in popularity drew its price upwards. However, traders are doubtful about the upcoming week.
MASK seems to be forming a pattern, however, it is hard to predict the price momentum without the confirmation of the pattern. Currently, there could be a possibility that a double top pattern could be formed, however, this could reverse if a double bottom is formed. Looking at the MA indicators, the gap between the 200MA and the 50MA continues to widen, this could also confirm that instead of a double top, a double bottom would be formed, thus leading the price higher. Therefore, traders must closely observe the price patterns and the indicators over time.
Read Also : Mask Network (MASK) Price Prediction 2022-2030
XRP (XRP)
Ripple Lab’s native token, XRP, made an unexpected entry into the market and proved that it is one of the top-performing coins for this week. Even though XRP would move often sideways, this digital token made an unexpected surge this week. Currently, XRP is priced at $0.4265 experiencing a surge of 14.51% in just seven days, however, it faced a downfall of 3.75% in 24 hours. Moreover, the trading volume is down by 41.40% to $1,722,409,614, indicating the demand for XRP is settling down.
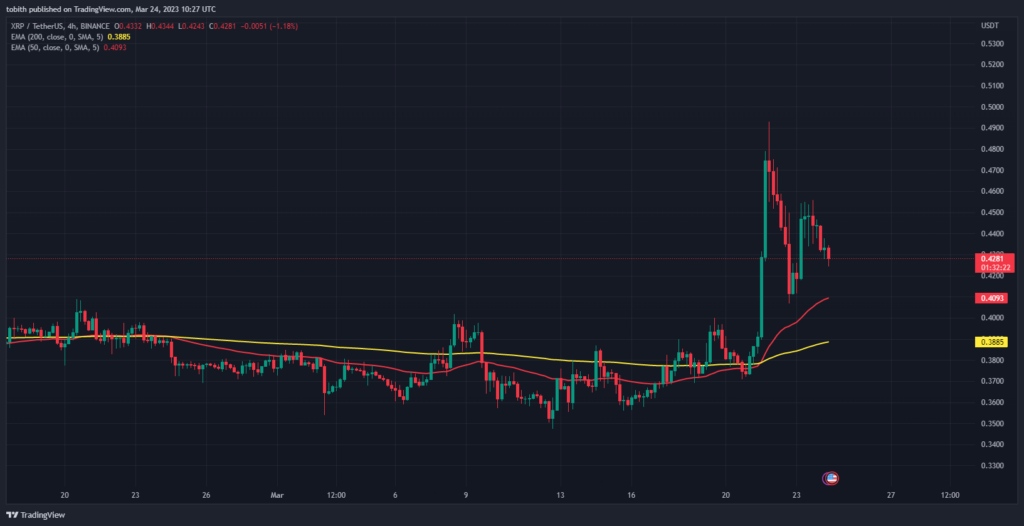
The 4-hour chart shows that XRP was below the 200EMA and the 50EMA, however, on Tuesday, XRP made a massive jump by 26.89%. This was one of XRP’s greatest breakthroughs as it was moving sideways for a long period of time, stuck below the $0.4 resistance level. After reaching 0.4745, the price dropped to $0.4065. Ever since then, the price has been struggling to stay top of the $0.4 resistance level.
Looking at the 50EMA and the 200EMA, a golden cross was formed on XRP’s Tuesday giant leap. This confirmed that XRP will run with the bulls, however, the gaps between these indicators are becoming narrow, indicating that the XRP’s bull run will soon be over. Traders should be cautious of XRP’s price movement as there is an indication that XRP might fall back to the support level and continue to move sideways for some time.
Read Also : XRP Price Prediction 2023-2030
Litecoin (LTC)
Litecoin returns to the list of top-performing coins after showcasing an incredible performance this week. LTC experienced a surge of 13.36% in one week, while its current price is at $92.87. With its market cap at $6,737,193,994, LTC also observed a slight price increase of 4.61% in 24 hours. LTC has a trading volume of $1,018,656,937, however, there was a fall of 12.19% in one day, indicating that traders’ demand for Litecoin reduced.
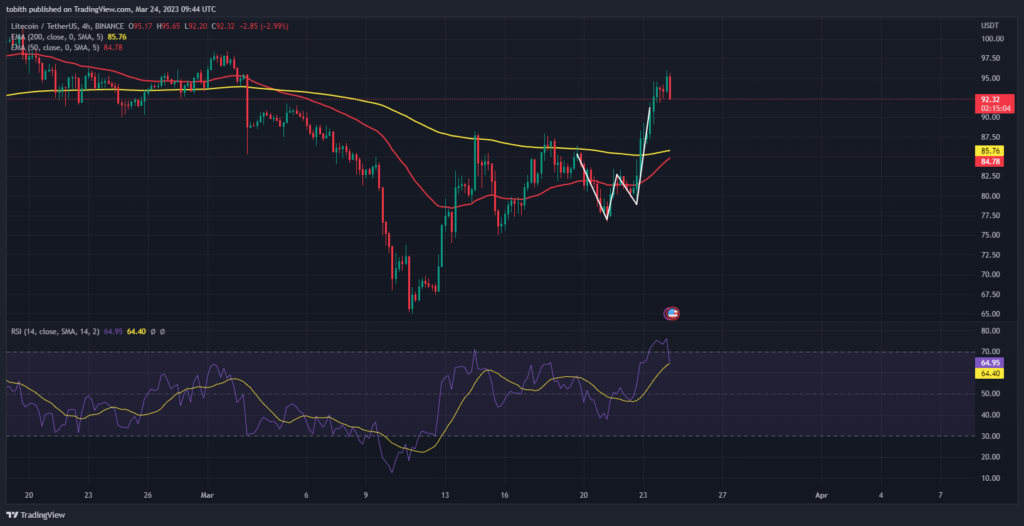
Looking at the 4-hour chart, LTC is facing an uptrend as the prices are above the 200 EMA and 50 EMA. Although the 200 EMA is above the 50 EMA, which is considered a signal for the bear trap, the gaps between these indicators continue to reduce. If the MA indicators cross and form a golden cross, this will confirm that LTC will continue to run with bulls for some time.
Moreover, the RSI is valued at 64.27 indicating that LTC has a strong trend as the the buyers continue to show demand and enter the market. However, RSI’s trajectory is faced downwards which could mean that it might divert away from the overbought region. Traders often shared their viewpoint that the 50 to 70 region is the ideal range, expecting the price continues to rise. However, traders should be cautious as the trend could reverse at any time.
Read Also : Litecoin Price Prediction 2022-2030
Cardano (ADA)
ADA has also joined the ranks as one of the top-performing coins after showcasing a tremendous performance this week. ADA is currently priced at $0.3617 with a spike of 5.95% in seven days. The market cap of ADA is at $12,576,730,244, however, it has a downfall of 2.66%. Similar to XRP, traders’ interest in ADA is diminishing as the trading volume fell by 38.26% to $377,078,995 in 24 hours.
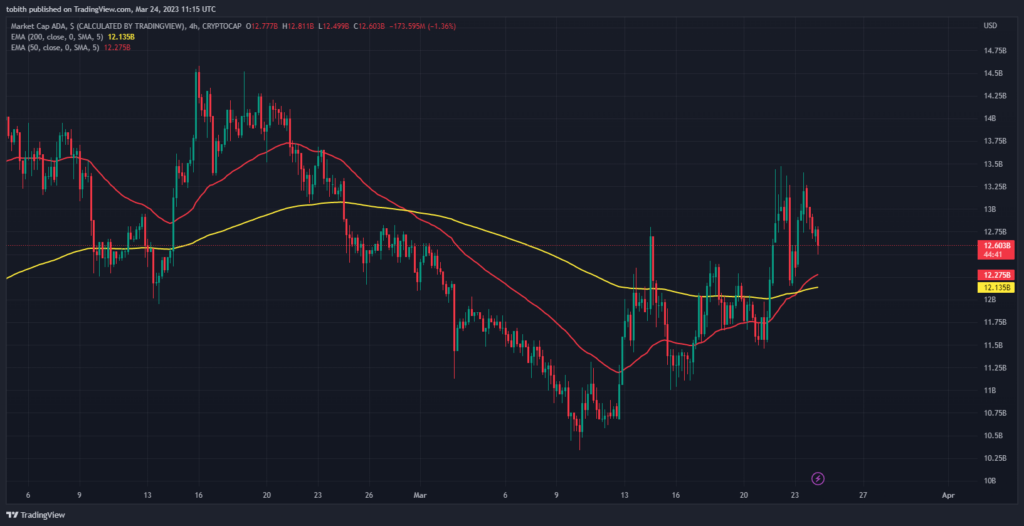
The 4-hour charts indicate that ADA could face a bull run soon as the 50 EMA and the 200 EMA crossed each other’s paths and formed a golden cross. Moreover, the price is above the indicator which also confirms that ADA’s sentiment is bearish.
However, looking at the candlesticks, they seem to give out a double top pattern which could mean that ADA could make an entry downwards. Unlike many of the top-performing coins, ADA actually formed the golden cross mid-week and the gap between the indicators continues to widen. Traders should especially observe the indicators closely and wait for a confirmation of whether the price will remain with bulls or bears.
Read Also : Cardano Price Prediction 2023-2030
Wrapped Bitcoin (WBTC)
Wrapped Bitcoin is a tokenized version of Bitcoin (BTC) that runs on the Ethereum (ETH) blockchain.
WBTC is compliant with ERC-20 — the basic compatibility standard of the Ethereum blockchain — allowing it to be fully integrated into the latter’s ecosystem of decentralized exchanges, crypto lending services, prediction markets, and other ERC-20-enabled decentralized finance (DeFi) applications.
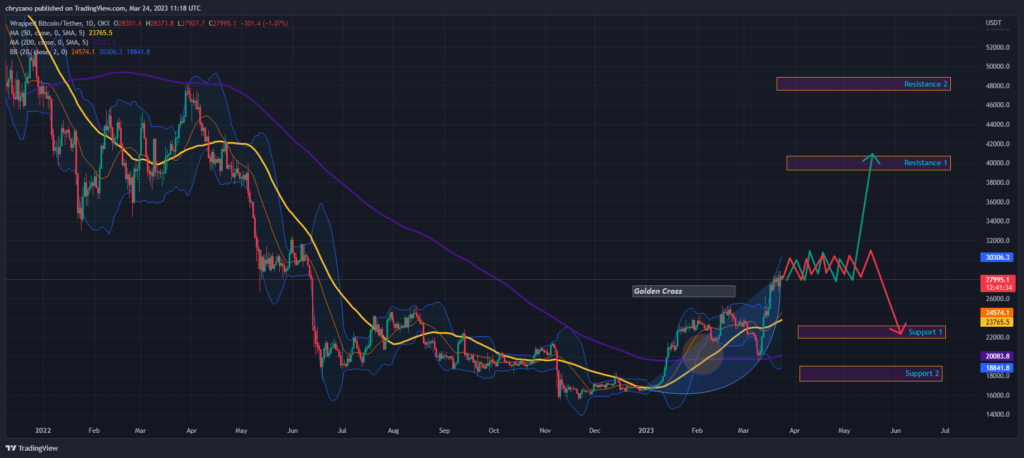
When considering the chart above, it could be noted that WBTC experienced a Golden cross where the 50-day MA intersected the 200-day MA from below. If WBTC continues in rising exponentially, then it could reach Resistance 1 at (≈$40,000). Although WBTC’s Golden cross produced a sudden surge in prices as a conventional one would, WBTC’s Golden cross was short-lived.
Just after a little spike, the prices dropped but fortunately the 200–day MA offered support to WBTC, hence it didn’t tank further. However, WBTC rose almost exponentially after rebounding on the 200-day MA.
The RSI is at 66.74 and is tilting down toward the signal. If it falls below the signal, then there could be a bearish trend in the future. Contrastingly, if the RSI is going to head over to the overbought region, above 70, then we could expect the market to correct the prices.
Moreover, the Bollinger bands too second the preceding thesis. The reason is that WBTC has touched the upper Bollinger band, hence, WBTC could fall down in price. Moreover, the widening bands too suggest that there is going to be more volatility in the coming days. In the event that WBTC falls, it may seek support near $22,500.
Read Also : Wrapped Bitcoin Price Prediction 2022-2030
Stacks (STX)
Stacks is a Bitcoin Layer for smart contracts; it enables smart contracts and decentralized applications to use Bitcoin as an asset and settle transactions on the Bitcoin blockchain.
When considering the daily chart for Stacks (STX) we can see that at present the coin is on the rise after a Golden cross. This behavior was seen back in May and June of 2022 when STX had a golden cross. Currently, STX is fluctuating while taking the same pattern as in May-June 2022. Hence, this makes us question whether STX is reciprocating this behavior now.
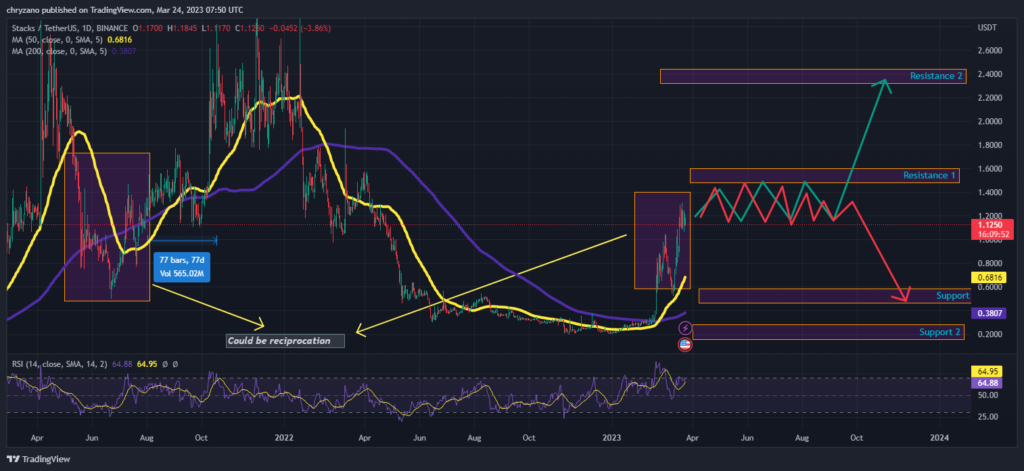
If STX is repeating its previous behavior as mentioned above then we could expect STX to break above Resistance 1 (≈ $1.5) and reach resistance 2 at (≈$2.4).
STX approximately took 77 days to reach resistance 2 as shown in the chart. So the question is, will Stacks take the same amount of time to surge?
On the contrary, the RSI is at 64.50 but titling down. If the RSI doesn’t reach the overbought region then STX could reach resistance 2 but if it does STX could go through some consolidation. However, if the bears are to take over the market, then we could expect STX to reach Support 1.
There is also the possibility that the 50-day MA and the 200-day MA could interject STX if it was to fall but if the bears are too strong then STX could break below these two lines.
Read Also : Stacks Price Prediction 2023-2030
Neo (NEO)
Neo bills itself as a “rapidly growing and developing” ecosystem that has the goal of becoming the foundation for the next generation of the internet — a new economy where digitized payments, identities, and assets come together.
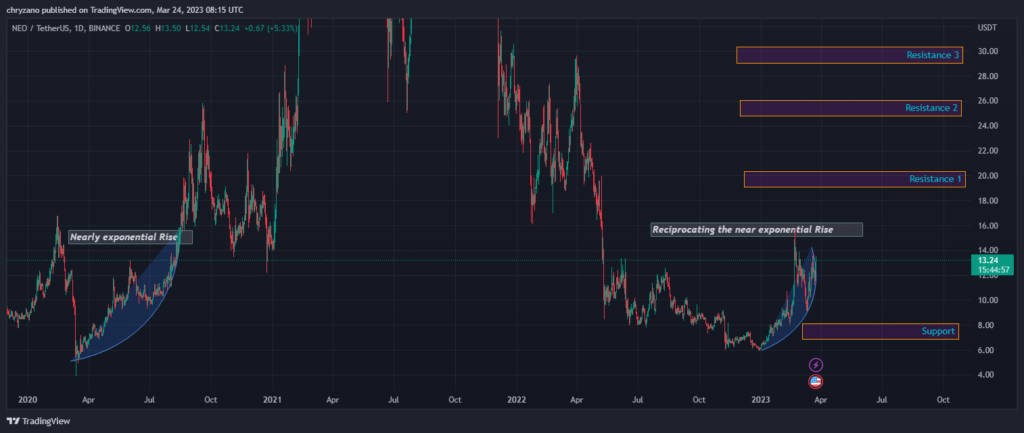
When considering the above chart, NEO has been on an up trend since late 2022. It has been making higher lows almost exponentially. The previous time this kind of near-exponential behavior was in April-October 2022. Moreover, NEO is showing the same kind of behavior as it showed during the time span mentioned in 2022. As such this could be a reciprocation of its behavior.
Therefore, we could expect the prices to reach resistance 2 at (≈$25). However, the bulls will need to bash through resistance 1 to reach resistance 2. There is also a possibility that NEO could be rejected at resistance 2. If the preceding is to happen then NEO could have a brief period of consolidation between Resistance 1 and the current price range it is fluctuating at.
Another possibility is that if NEO is rejected from resistance 2, then it could fall to support at (≈$7.5).
Read Also : Neo Price Prediction 2022-2030
Nexo (NEXO)
Nexo is a blockchain-based lending platform that offers users instant cryptocurrency-backed loans. The project was first announced in December 2017, and it launched in April 2018. Nexo was founded by a team of finance professionals and crypto enthusiasts.
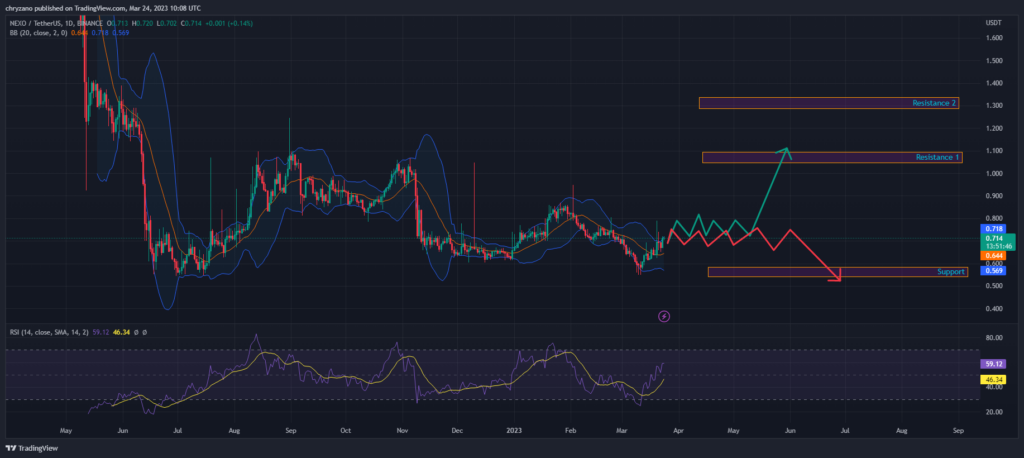
When considering the chart above Nexo has been on a bull run since March, if this trend continues NEXO could reach resistance 1 at (≈$1.1). But the Bollinger bands don’t support the preceding sentiment. The reason is that NEXO has touched the upper Bollinger band and as such a correction is due in the near future. Hence, if there is a correction the price of Nexo could go down.
Additionally, the RSI at 59.28 shows that the trend is strong. The RSI is parallel to the horizontal axis. However, if the RSI goes into an overbought region above 70, then the market could correct the prices. In the event the market corrects prices, the bulls could take over the market and if this happens, then NEXO could tank to support at ($0.5).
Read Also : Nexo Price Prediction 2022-2030
Conclusion
Many of the cryptos mentioned above have already formed a golden cross and are expected to experience an uptrend over the coming days. XRP was one of the coins that made an unexpected entry as it was moving sideways for a long time. Moreover, many top-rankling coins like LTC and ADA also made it to the list, indicating a bullish season is near. Concurrently, traders should be cautious of any trend reversal that could happen in the future.
Disclaimer: The views and opinions, as well as all the information shared in this price analysis, are published in good faith. Readers must do their own research and due diligence. Any action taken by the reader is strictly at their own risk, Coin Edition and its affiliates will not be held liable for any direct or indirect damage or loss.
Disclaimer: The information presented in this article is for informational and educational purposes only. The article does not constitute financial advice or advice of any kind. Coin Edition is not responsible for any losses incurred as a result of the utilization of content, products, or services mentioned. Readers are advised to exercise caution before taking any action related to the company.
 Price Prediction 2026-2030: Will TRX Hit $0.50 Soon?")
 Price Prediction 2026-2050: Will HYPE Hit $100 Soon?")


: What Happens If You Use an Unlicensed Platform?")