


- BNB’s price rose 11.57% in a week, hitting a high of $615.38.
- Trading volume surged 4.32%, signaling increased investor interest.
- Despite bullish trends, technical indicators hint at possible corrections.
Over the past week, Binance’s BNB token has enjoyed a robust bullish trend, marking an 11.57% increase in value. Throughout this period, its price has fluctuated between $615.38, its weekly high, and $528.57, its weekly low. However, in the last 24 hours, the bullish momentum has tempered slightly. As of press time, the BNB token is trading at $607.83, reflecting a modest increase of 0.08%.
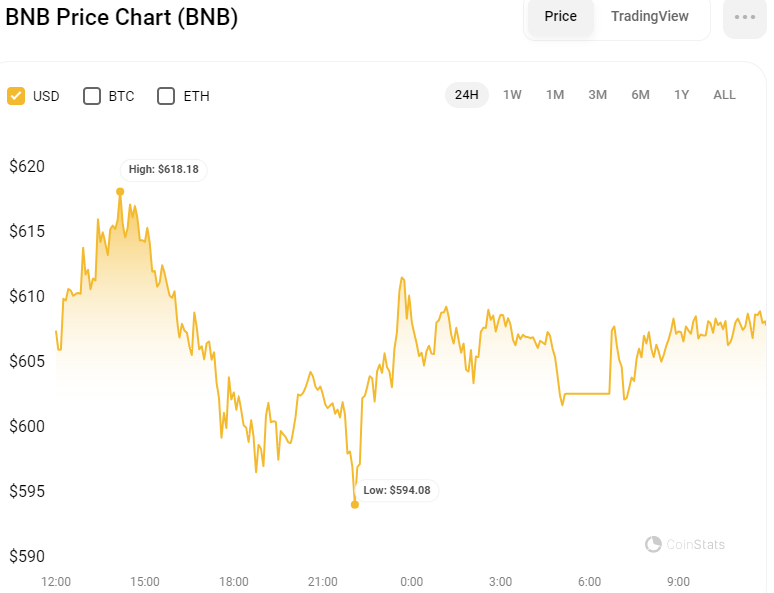
BNB/USD 24-Hour Chart (Source: CoinStats)
In tandem with this, its intraday market capitalization has followed a similar trajectory, edging up by 0.09% to reach $89,726,634,461. Notably, trading volume has surged over the past day, climbing by 4.32% to $1,479,606,735. This surge in trading volume suggests heightened investor interest and engagement with the BNB token despite the recent moderation in bullish sentiment.
Prominent crypto analyst Captain Faibik echoes this sentiment, suggesting potential for a significant bullish wave, estimating it to be in the range of 40-45% in the short term.
BNB/USD Price Action
The BNB token is demonstrating a bullish pattern on the 4-hour chart, characterized by a consistent trajectory where new highs surpass previous peaks and old lows remain solid. This positive momentum is supported by a 20.6% increase from its recent swing low, which was established a week ago, as depicted by the price range tool.
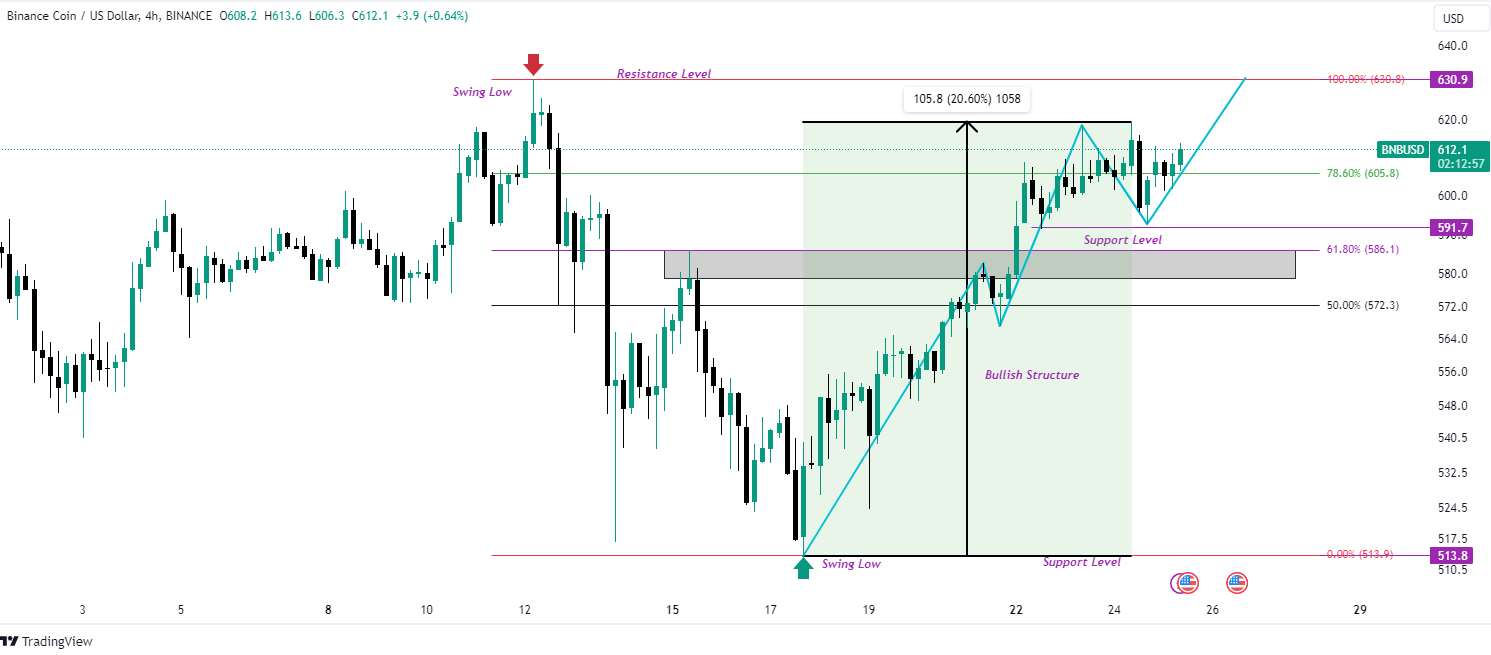
BNB/USD 4-Hour Chart (Source: Tradingview)
As of press time, the price of the BNB token is above the 78.6% Fibonacci retracement level, targeting the $630.9 mark, which serves as a critical resistance point during this period. Despite the bullish signs, there are potential risks from bearish forces. Should the bears gain control, the BNB price might retreat to test the support level beneath it before potentially rebounding.
Contrasting with this optimistic trend, technical indicators suggest a more cautionary scenario. The Moving Average Convergence Divergence (MACD) indicator is showing signs of bearish sentiment as it points downward at 8.3, positioned below the signal line. This orientation suggests a possible bearish trend in the near future.

BNB/USD 4-Hour Chart (Source: Tradingview)
However, since it remains in the positive region, this bearishness could represent a brief correction within an overall bullish context and may not persist. Additionally, the MACD histogram is expanding its red, below-zero bars, indicating that bearish sentiment is intensifying.
Parallel to these indicators, the Chaikin Money Flow (CMF) indicator reinforces the concern of bearish pressure. With the CMF moving below the zero line at 0.11, it signals a reduction in money flowing into the market, which could exacerbate the downward price movement in the short term.
Disclaimer: The information presented in this article is for informational and educational purposes only. The article does not constitute financial advice or advice of any kind. Coin Edition is not responsible for any losses incurred as a result of the utilization of content, products, or services mentioned. Readers are advised to exercise caution before taking any action related to the company.
: What Happens If You Use an Unlicensed Platform?")


