


 Gearing Up for a Strong Move, According to Analyst")
- Crypto Rover, an analyst and trader, revealed that a breakout chart pattern had formed on BTC’s chart.
- According to the analyst, BTC could either rise to as high as $63K or drop to as low as $12K in the next 5-10 weeks.
- From a shorter-term perspective, BTC was trading in a positive price channel at press time.
The cryptocurrency trader and analyst Crypto Rover predicted in an X post yesterday that the market leader Bitcoin (BTC) may experience a big price move in the coming 5-10 weeks. In the post, the analyst revealed that a symmetrical triangle had formed on the leading cryptocurrency’s chart.
This specific chart pattern suggests that BTC’s price may break out soon. According to Crypto Rover, a break towards the downside could lead to the cryptocurrency’s price dropping to as low as $12,000. Meanwhile, he also shared that his bullish target for the breakout is at $63,000.
Meanwhile, over the past 24 hours, BTC was able to record a 24-hour gain. At press time, CoinMarketCap data indicated that the leading cryptocurrency was changing hands at $27,688.24 following a 1.10% increase in price throughout the past day of trading.
This recent gain added to BTC’s positive weekly streak. Subsequently, the cryptocurrency’s price rose 4.65% over the past 7 days.
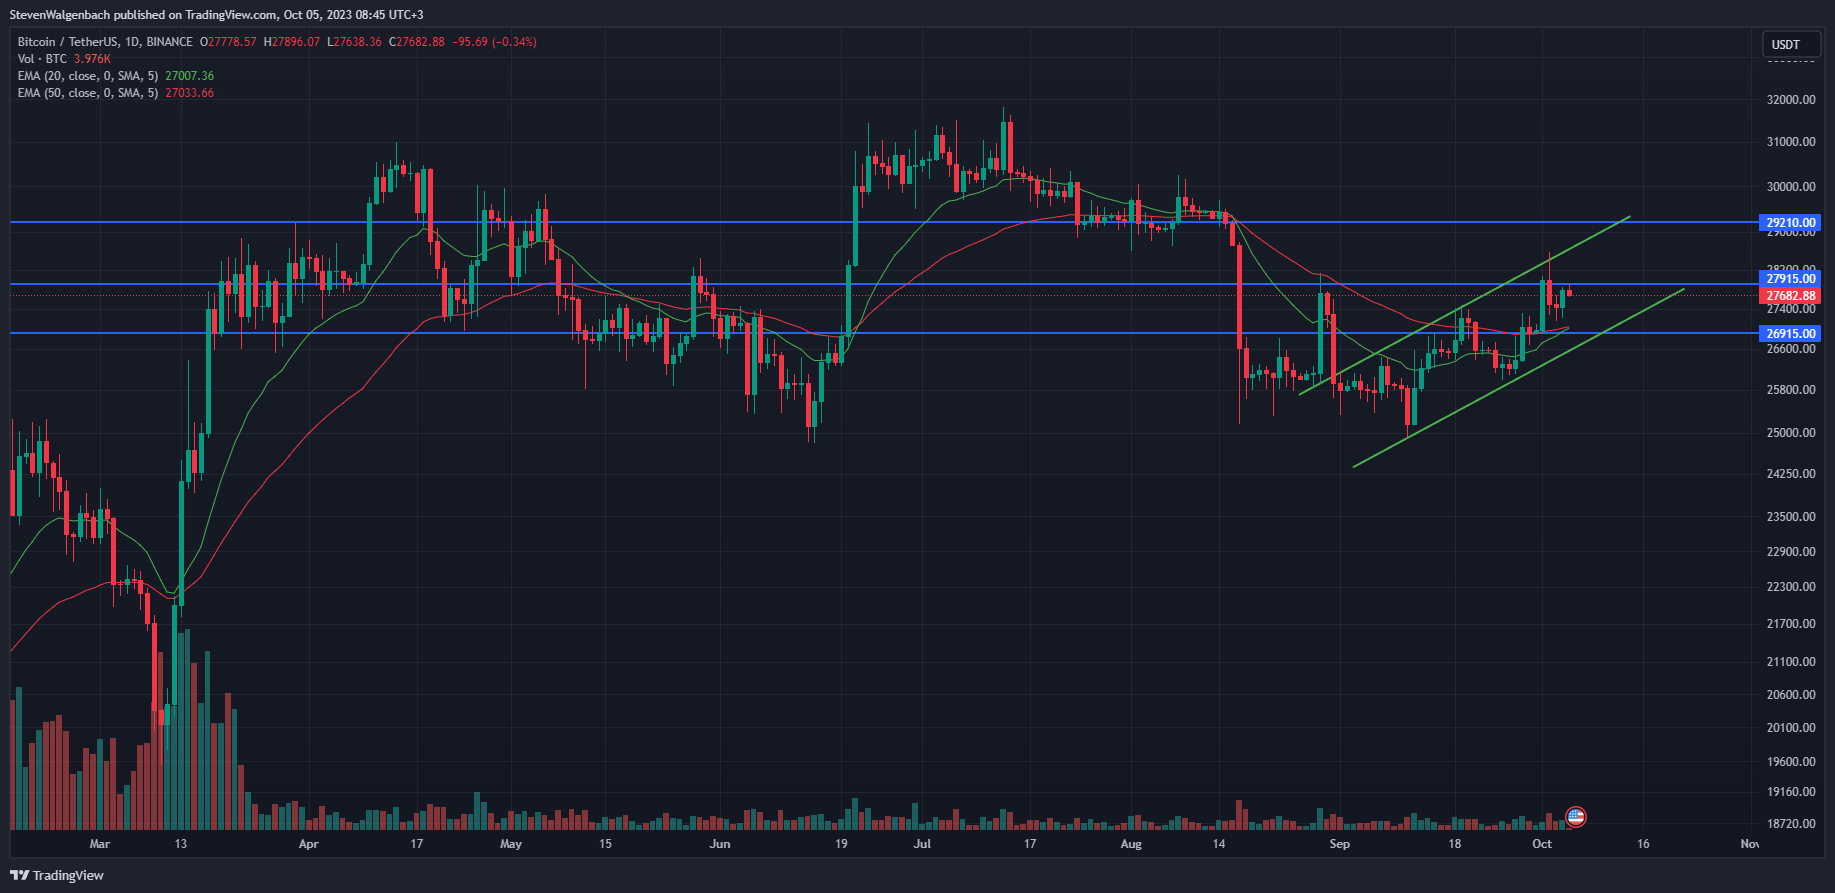
From a technical standpoint, a positive price channel had formed on BTC’s daily chart over the past few weeks. During this time, the cryptocurrency’s price printed a series of higher highs and higher lows. As a result, the cryptocurrency was attempting to overcome the $27,915 resistance level at press time.
Should BTC close a daily candle above this threshold within the next 48 hours, then it may continue to trade within the bullish price channel to potentially rise to as high as $29,210 in the following week. Conversely, BTC failing to close a daily candle above this resistance level in the next 2 days may lead to its price correcting to the immediate support level of $26,915.
Investors and traders will want to note that a significant medium-term bullish technical flag was on the cusp of being triggered. At press time, the 20-day EMA line was attempting to cross above the 50-day EMA line. This suggests that BTC’s momentum was busy undergoing a positive shift.
If these two technical indicators cross in the next few days, then it may indicate that buyers have the upper hand on BTC’s daily chart. Subsequently, the market leader’s price may have the support needed to rise to the aforementioned $29,210 mark.
Disclaimer: The information presented in this article is for informational and educational purposes only. The article does not constitute financial advice or advice of any kind. Coin Edition is not responsible for any losses incurred as a result of the utilization of content, products, or services mentioned. Readers are advised to exercise caution before taking any action related to the company.


