



- Spot Bitcoin ETFs recorded $2.14B in net outflows across nine trading sessions.
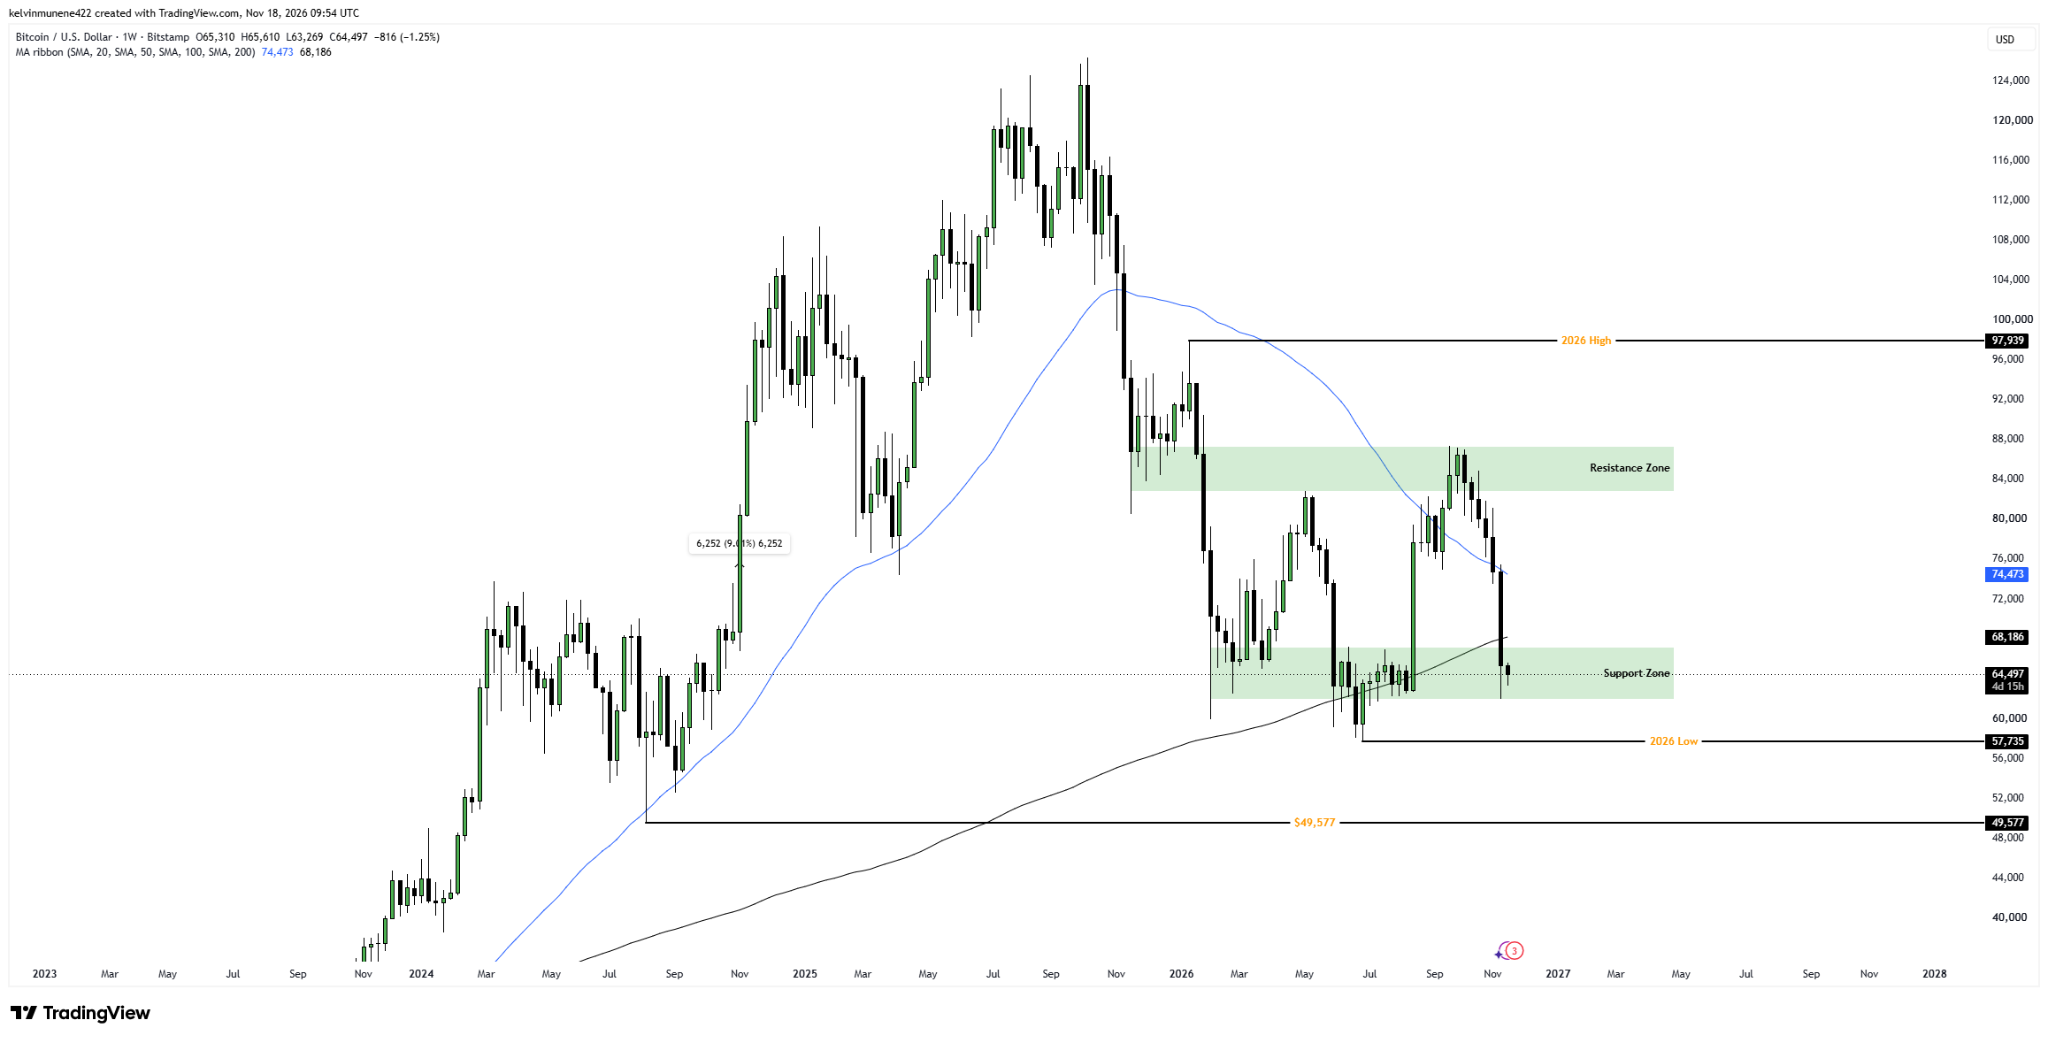
- Bitcoin price trades at $64,497 within its weekly support zone of $61,947–$67,187.
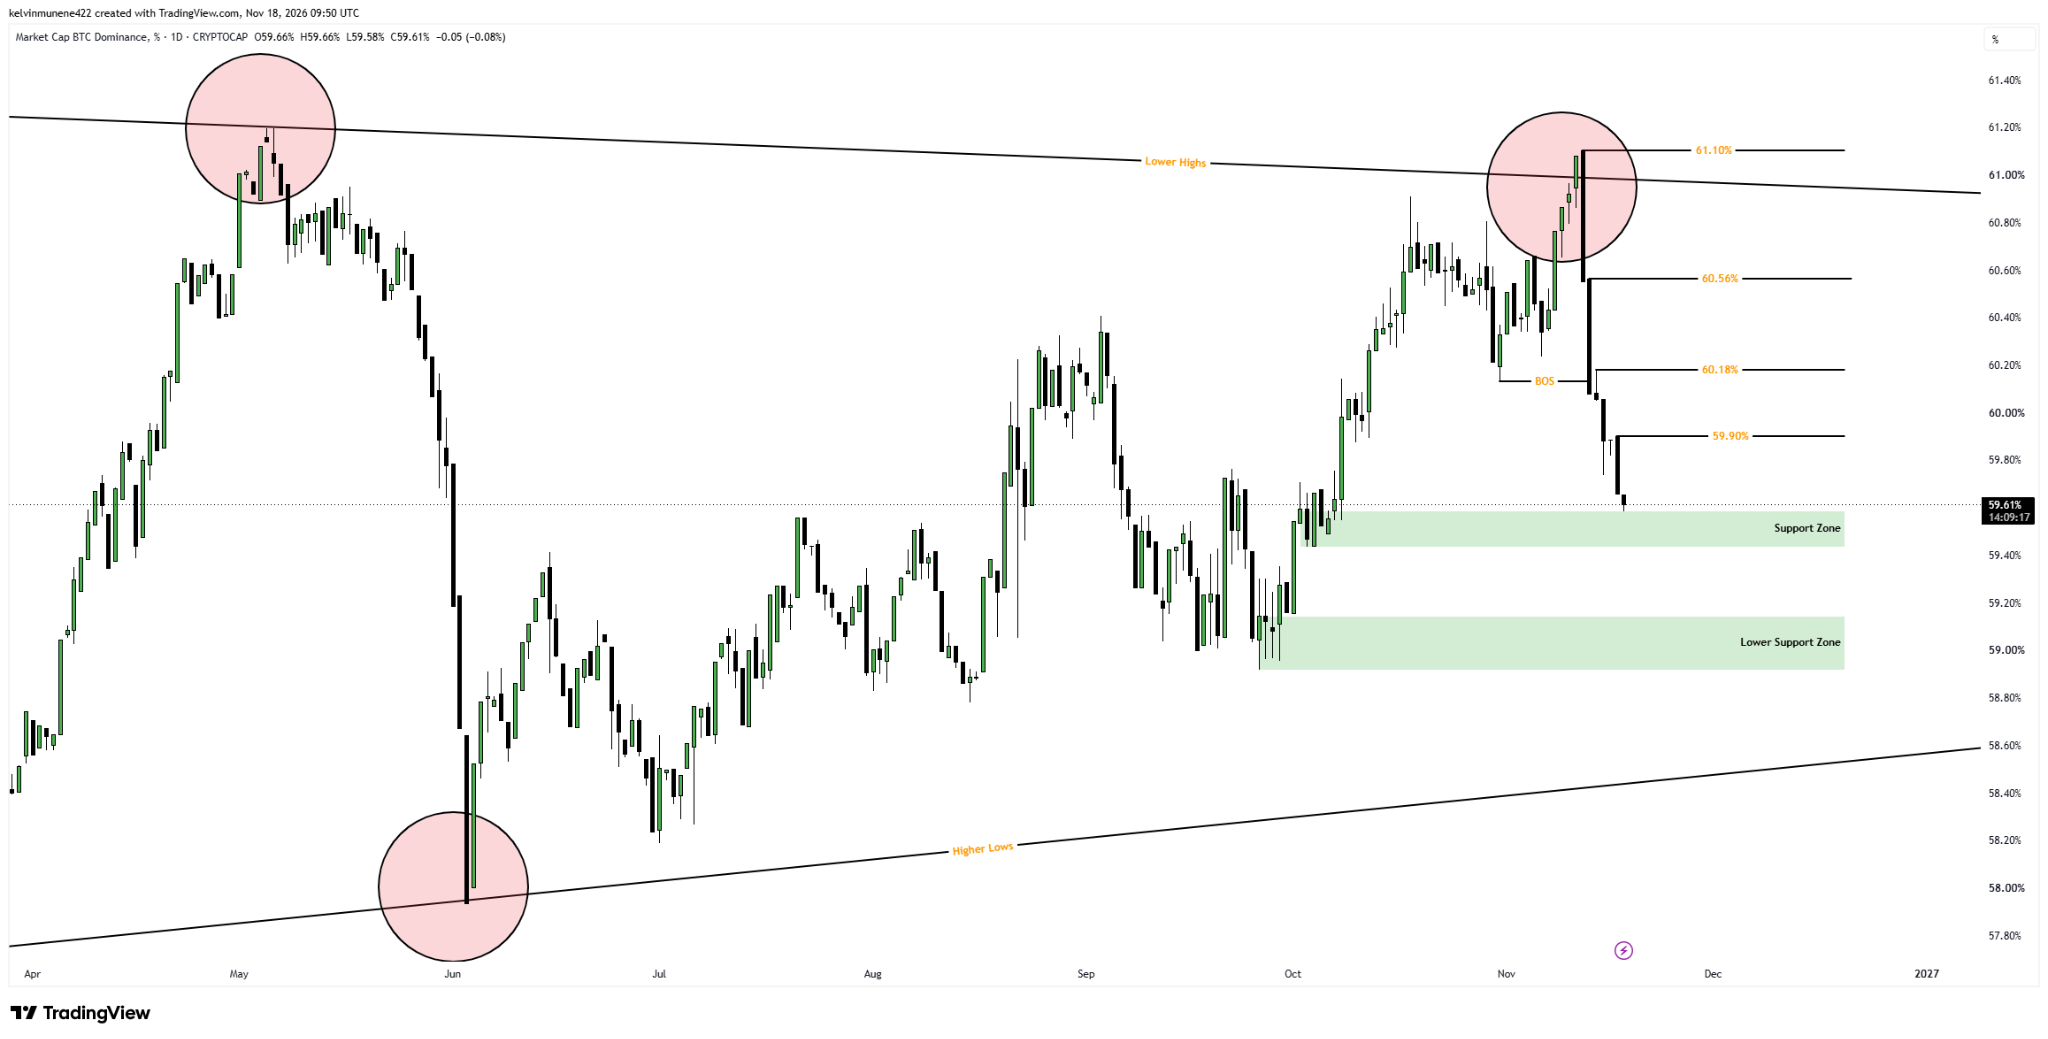
- Bitcoin dominance falls to 59.61%, nearing key support between 59.44% and 59.59%.
U.S. spot Bitcoin ETFs lost $2.14 billion in net outflows over nine trading sessions as BTC fell back into a weekly support region. Bitcoin’s share of the wider cryptocurrency market has also declined, with dominance approaching 59.59% following a recent rejection above 61%.
| Level | Price | Significance |
| Resistance 1 | $68,186–$74,473 | Moving averages |
| Resistance 2 | $82,833–$87,374 | Major resistance |
| Support 1 | $61,947–$67,187 | Current support zone |
| Support 2 | $57,735 | 2026 low |
| Support 3 | $49,577 | Historical support |
Bitcoin ETF Outflows Resume as Investor Demand Weakens
Figures from Farside Investors show withdrawals in eight of the nine trading sessions between November 5 and November 17, representing an estimated 25,600 BTC. Seven consecutive sessions of withdrawals ended on November 16, when the funds attracted $7.9 million.
A day later, however, investors pulled another $239.9 million, equivalent to roughly 3,700 BTC at prevailing prices. BlackRock’s IBIT accounted for $209.5 million of those withdrawals, while Grayscale’s GBTC and ARKB lost $17.7 million and $13.1 million, respectively.
Despite the recent withdrawals, cumulative net inflows remain substantial at approximately 686,000 BTC, equivalent to $54.47 billion based on historical flow values. Meanwhile, Bitcoin was trading at $64,497 on November 18, within its weekly support region.
Although the ETF figures do not distinguish between institutional and retail investors, eight negative sessions out of nine point to weakening demand.
Follow us on X for real-time crypto updates.
Bitcoin Price Tests $61,947–$67,187 Weekly Support as Demand Weakens
On the weekly chart, Bitcoin was trading at $64,497 on November 18 after retreating from resistance between $82,833 and $87,374. The sell-off took BTC below its 50-week and 200-week moving averages at $74,473 and $68,186, respectively. The token now trades within the $61,947–$67,187 weekly support zone.
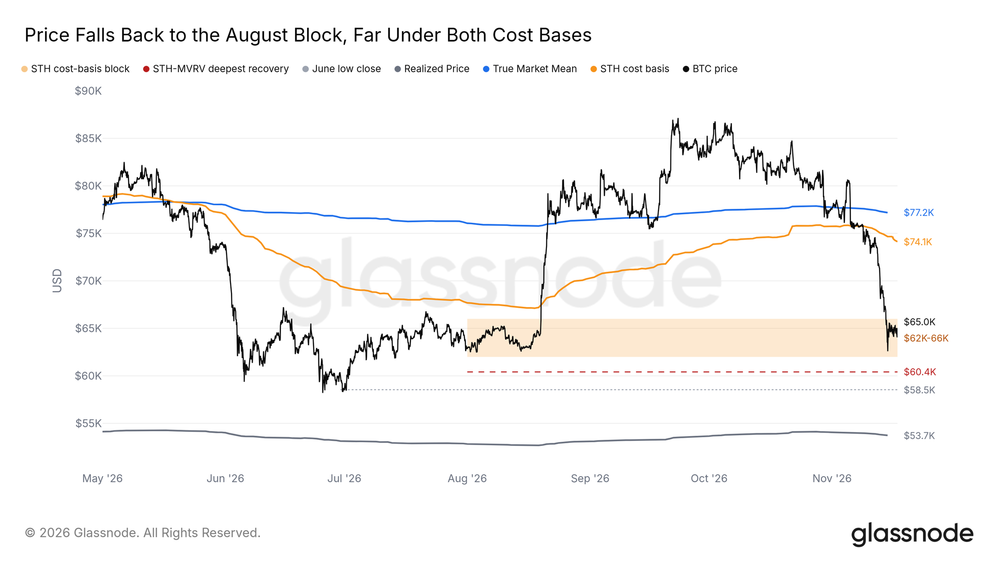
The region overlaps with an area identified in Glassnode’s November 17 market analysis. The firm identified a concentration of recent buyers between $62,000 and $66,000, although broader demand remained weak.
Should Bitcoin close the week below $61,947, the next major level sits at its 2026 low of $57,735. Historical support lies further down at $49,577. A recovery, meanwhile, would require BTC to reclaim both moving averages before revisiting the resistance zone.
Bitcoin Dominance Nears 59.44%–59.59% Support After Bearish Break
While Bitcoin struggles to defend its weekly support, its market dominance also faces mounting pressure. On the weekly chart, BTC’s dominance continues to form lower highs and higher lows within a symmetrical triangle. Its latest rejection near 61.10% was followed by a bearish break of structure around 60.18% on the daily timeframe.
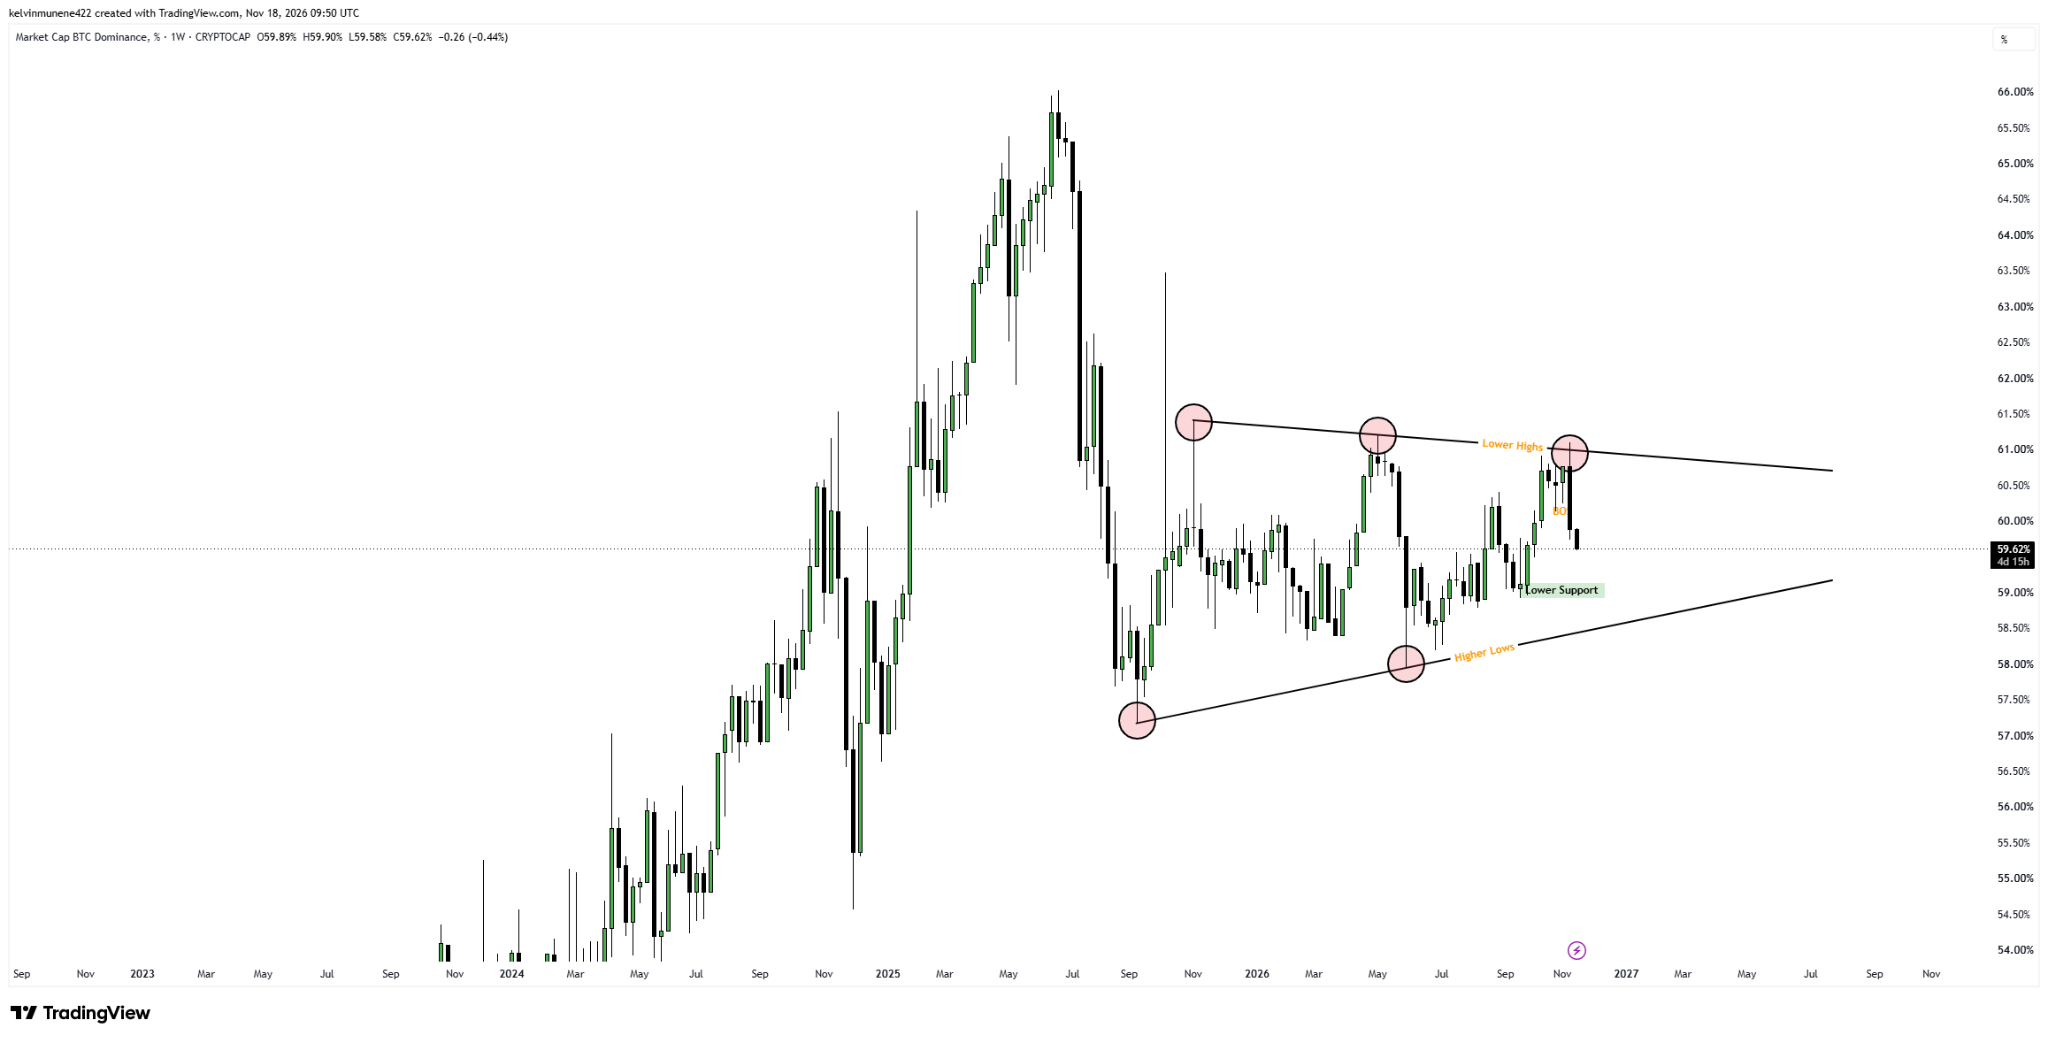
Dominance has since slipped to 59.61%, placing it just above the 59.44%–59.59% support zone. A break below this region could extend the decline toward the next support area between 58.92% and 59.14%. With both the BTC price and Bitcoin dominance declining, Bitcoin has underperformed the broader cryptocurrency market during the recent sell-off.
However, this loss of market share does not necessarily mean altcoins are recording gains. If ETF withdrawals persist and both support zones fail, Bitcoin could face further price weakness while losing market share.
On the other hand, a return to positive ETF flows alongside rising prices and dominance could signal recovering demand for BTC. However, if Bitcoin rebounds while dominance continues to decline, altcoins could be recording stronger relative gains.
Bitcoin Dominance Support and Resistance Levels
| Level | Dominance | Significance |
| Resistance 1 | 60.18% | Broken structure |
| Resistance 2 | 61.10% | Recent rejection |
| Support 1 | 59.44%–59.59% | Immediate support |
| Support 2 | 58.92%–59.14% | Lower support zone |
Bullish Case
Bitcoin’s renewed ETF inflows and a recovery above $74,473 could expose $87,374.
Bearish Case
However, a BTC weekly close below $61,947 could expose $57,735 and subsequently $49,577 lows.
Neutral Case
Meanwhile, the BTC token could consolidate within its support zone while dominance stabilizes.
FAQs
Bitcoin ETFs have lost approximately $2.14 billion across nine trading sessions.
The immediate Bitcoin support lies between $61,947 and $67,187.
Yes, BTC could fall to $57,735 if the weekly support at $61,947 fails.
Declining Bitcoin dominance suggests that BTC is losing relative cryptocurrency market share.
Subscribe to our YouTube channel for the latest crypto news.
Related: XRP Price Risks a Drop to $0.64 Despite $127M in Binance Whale Withdrawals
Disclaimer: The information presented in this article is for informational and educational purposes only. The article does not constitute financial advice or advice of any kind. Coin Edition is not responsible for any losses incurred as a result of the utilization of content, products, or services mentioned. Readers are advised to exercise caution before taking any action related to the company.