


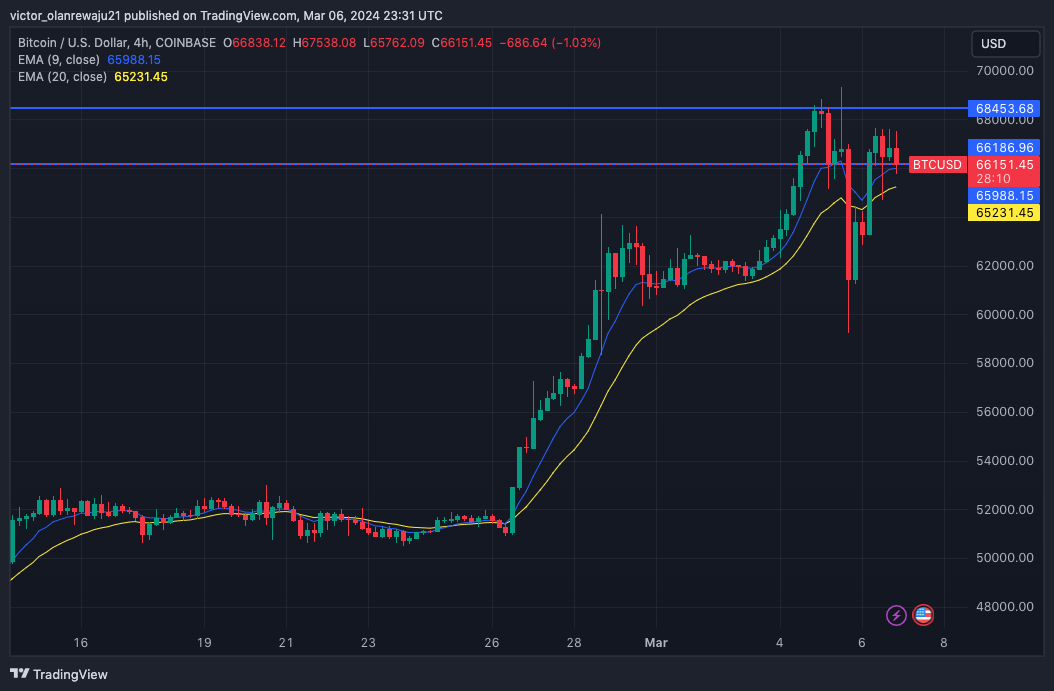
- The 4-hour chart displayed a resistance at $68,453, indicating that bulls had work to do.
- If the EMAs maintain the momentum gained from the golden cross, Bitcoin could rise to $72,000.
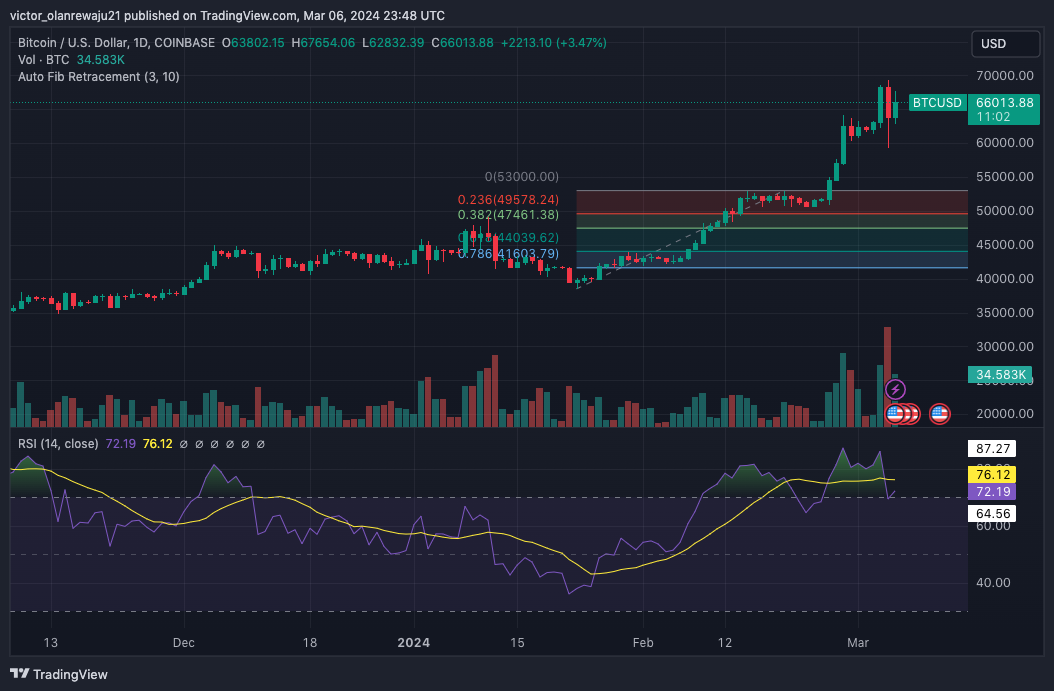
- The Fibonacci retracement on the daily chart showed that a correction to $49,578 was possible.
After hitting a new all-time high on March 5, and facing a price collapse later, Bitcoin (BTC) was back above $67,000. At press time, CoinMarketCap showed that the coin has gained 3.98% in the last 24 hours, indicating that the selling pressure initially experienced was fizzling out.
A critical analysis of the 4-hour BTC/USD chart showed that bulls were aggressively buying the dip. Furthermore, demand for Bitcoin ETFs as well as the hike in spot volume contributed to the recovery.
Bitcoin 4-Hour Analysis
As it stands, bears risk being put out of the market. At press time, buyers might face a resistance at $68,453. If bulls push the price above the resistance, Bitcoin might reclaim $69,000 for a start.
Furthermore, the successful close could lead to an extension which puts BTC as high as $72,000. But that would depend on the bulls’ ability to defend the $66,186 support. However, rejection at the resistance could force a descending trend that could plunge Bitcoin below $63,000.
In addition, the 9 EMA (blue) was above the 20 (EMA) indicating a bullish trend. If BTC stays above both EMAs, then the bullish bias earlier mentioned could be validated. But BTC’s decline below the 9 EMA could lead to a minor correction which traders should watch out for.
BTC/USD Daily Chart
On the daily timeframe, Bitcoin seemed ready to retest its historic high. But unlike the 4-hour chart, there was no resistance ahead.
On March 5, Bitcoin hit an overbought level as indicated by the Relative Strength Index (RSI). This was one of the reasons the price retraced below $64,000 on the same day. However, the RSI reading has remained lower than it was on the aforementioned day.
This reading implied increasing bearish momentum which could make it difficult for BTC to cross into the $70,000 region. In a highly bearish scenario, Bitcoin’s price might pull back to $49,578 (the 0.236 Fibonacci retracement).
However, this correction might not happen until the end of BTC halving, as capital could rotate from Bitcoin into other cryptocurrencies. Meanwhile, the short-term outlook seems bullish for the coin. If buying pressure continues to increase, BTC could jump above $72,000.
BTC reaching $76,000 could be a little challenging. However, it was not out of place considering the bullish factors and demand for Bitcoin.
Disclaimer: The information presented in this article is for informational and educational purposes only. The article does not constitute financial advice or advice of any kind. Coin Edition is not responsible for any losses incurred as a result of the utilization of content, products, or services mentioned. Readers are advised to exercise caution before taking any action related to the company.


 at its $25 Infancy, Say Analysts")


