



- Bitcoin enters November 17–23 with weak weekly momentum as BTC struggles to reclaim $65,700.
- U.S. spot Bitcoin ETFs recorded $1.91 billion in net outflows over seven consecutive trading sessions.
- A break below $62,000 could expose BTC to the $56,326-$54,512 projected range.
Bitcoin is struggling to regain bullish momentum as it enters the November 17–23 trading week, with sellers still controlling the broader trend. BTC recently rebounded from $62,006 but remains below the $65,700 resistance area, while weekly momentum indicators continue to show weakness. Whether buyers can defend the recent low and push Bitcoin above resistance could determine its next move, with a deeper decline still possible if support breaks
Weekly Momentum Leaves BTC Vulnerable
The Binance BTC/USDT weekly chart shows the candle opening at $65,351, reaching a high of $65,696 and falling to a low of $63,905 before trading near $64,436. The broader structure shows lower highs after the 2025 peak, suggesting recovery attempts have struggled to attract sustained demand.
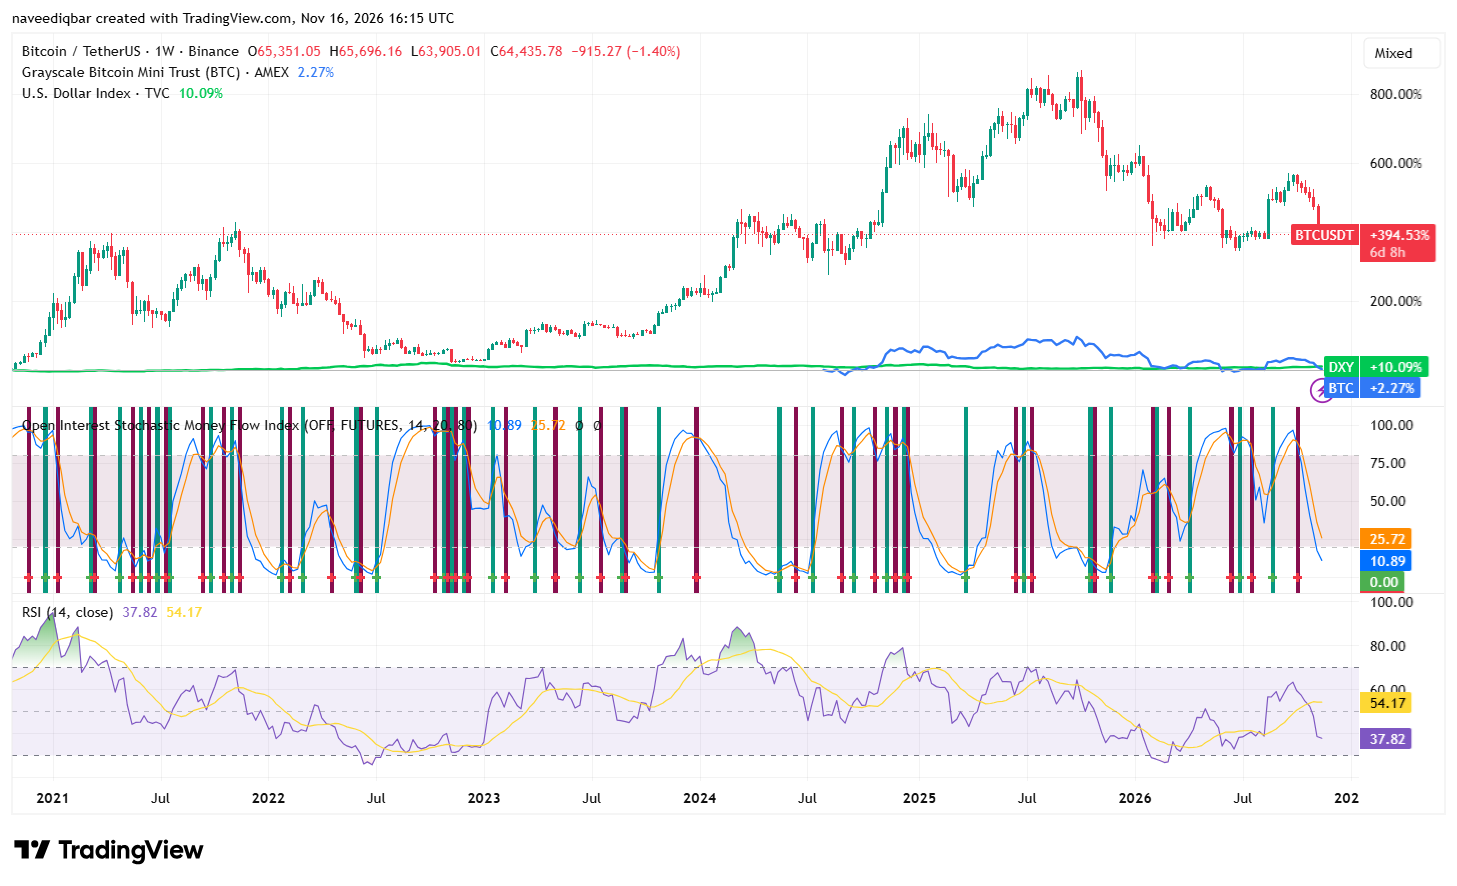
The weekly Relative Strength Index stands at 37.82, below the neutral 50 line. This keeps momentum bearish. The Open Interest Stochastic Money Flow Index is also weak, with readings of 10.89 and 25.72. Its blue line has fallen below the 20 threshold, suggesting selling pressure may be stretched. However, an oversold reading does not confirm a bottom. A higher turn in the oscillator and an RSI recovery toward 50 would provide stronger evidence that buyers are returning.
The recent $62,006 low is the first support to monitor. Holding above it could allow BTC to consolidate and test the current weekly high near $65,700. A sustained break below support, particularly on a weekly close, would weaken the recovery case.
ETF Outflows and Macro Risks Add Pressure
Binance founder Changpeng Zhao said there is no confirmed single explanation for the crypto sell-off and warned that correlation does not prove causation. He listed ETF outflows, security incidents, hotter U.S. inflation, rate-hike expectations, and political uncertainty as possible pressures. He also rejected speculation that Binance had sold crypto.
One hypothesis he referenced came from Matt Cole, CEO of Strive. Cole compared Bitcoin’s 19% fall in the 50 days before SpaceX’s June listing with its roughly 18% decline ahead of Anthropic’s planned IPO next week. He suggested capital could be shifting toward the offering, which may seek up to $64 billion. That comparison does not prove IPO positioning caused Bitcoin’s decline.
Separately, U.S. spot Bitcoin ETFs recorded approximately $1.91 billion in combined net outflows across seven consecutive trading sessions between November 5 and November 13, according to Farside Investors’ daily fund-flow data.
Bitcoin Price Scenarios for November 17–23
Sources project a possible downward drift, with its average near $64,527 on Tuesday and a lower weekend band between $54,512 and $56,326 if support fails. This remains a forecast, not a confirmed destination.
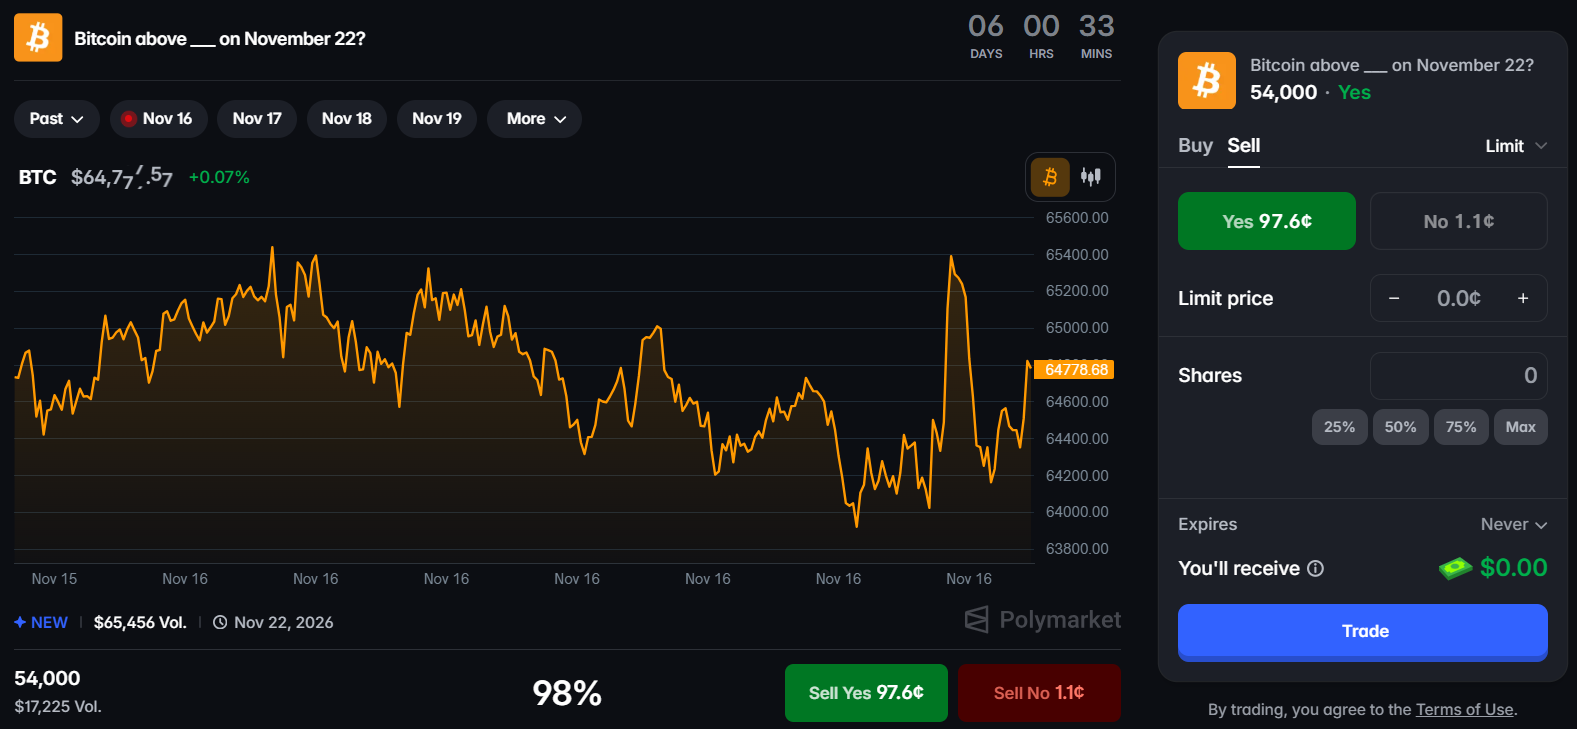
The supplied Polymarket chart priced a 98% probability that Bitcoin would stay above $54,000 on November 22. Its displayed volume was about $17,225, so the odds should not be treated as broad market consensus.
Bitcoin Price Levels to Watch
| Level | Significance |
| $65,696 | Current weekly candle high and immediate resistance |
| $62,006 | Recent low and near-term support |
| $56,326-$54,512 | Traders Union’s projected lower weekend range |
| $54,000 | Polymarket’s November 22 threshold, priced near 98% yes |
| $68,000-$70,000 | Potential recovery area if BTC clears $65,700 |
Bullish Case
BTC defends $62,000, reclaims $65,700, and builds momentum toward $68,000-$70,000. Easing ETF outflows would strengthen that recovery.
Bearish Case
A decisive break below $62,000 could expose the $56,326-$54,512 forecast zone, particularly if ETF withdrawals persist.
Neutral Case
BTC remains between roughly $62,000 and $65,700 while traders wait for clearer signals from ETF flows, inflation, and Federal Reserve expectations.
Until Bitcoin reclaims resistance and its indicators improve, any rebound may remain corrective rather than mark a confirmed trend change.
FAQ
The first support level traders need to watch out for is the recent swing low of $62,006. If this level is convincingly broken below, Bitcoin could be heading toward deeper declines.
Weekly RSI: 37.82 (bottom is 50). Weekly RSI remains on the bearish side; again, not confirming a bottom at the moment. We need to see the RSI continue recovering towards 50 to confirm the speed of the bullish momentum.
Traders Union estimates that the potential weekend range can be between $54,512 and $56,326 if support holds. This is not a price target but an estimated range only if support holds.
Potential catalysts are spot ETF outflows, security concerns, higher U.S. inflation, rate-hike expectations, and political uncertainty. Matt Cole mentioned that capital could also be moving towards an Anthropic IPO. None of these has been confirmed.
Lifting $62,000 and regaining the weekly high at close to $65,700, while lifting momentum indicators, can reinforce the bullish outlook. Letting off ETF can also help the trend recover.
Subscribe to our YouTube channel for the latest crypto news.
Related: XRP Price Prediction: Can a Weekly RSI Near 20 Mark a Bottom for XRP?
Disclaimer: The information presented in this article is for informational and educational purposes only. The article does not constitute financial advice or advice of any kind. Coin Edition is not responsible for any losses incurred as a result of the utilization of content, products, or services mentioned. Readers are advised to exercise caution before taking any action related to the company.