
- Bitcoin consolidates near $121K as traders balance profit-taking and accumulation.
- Futures open interest surges to $90B, signaling leveraged optimism and volatility.
- Veteran whale’s $438M short bet raises caution despite ongoing market accumulation.
Bitcoin is trading near $121,550 after failing to hold above its recent peak of $126,272. The market is showing consolidation, with traders split between profit-taking and renewed accumulation. Significantly, derivatives data and spot flows reveal diverging investor sentiment as a veteran trader placed a massive short bet against the top cryptocurrency.
Market Consolidation After a Sharp Rally
Bitcoin surged from $108,667 to $126,000 before encountering heavy resistance that triggered a retracement. The 4-hour chart now shows price stabilization between $121,000 and $119,500, areas aligning with key Fibonacci and EMA supports. Buyers are defending the 0.618 Fibonacci zone at $119,547, preventing deeper declines.
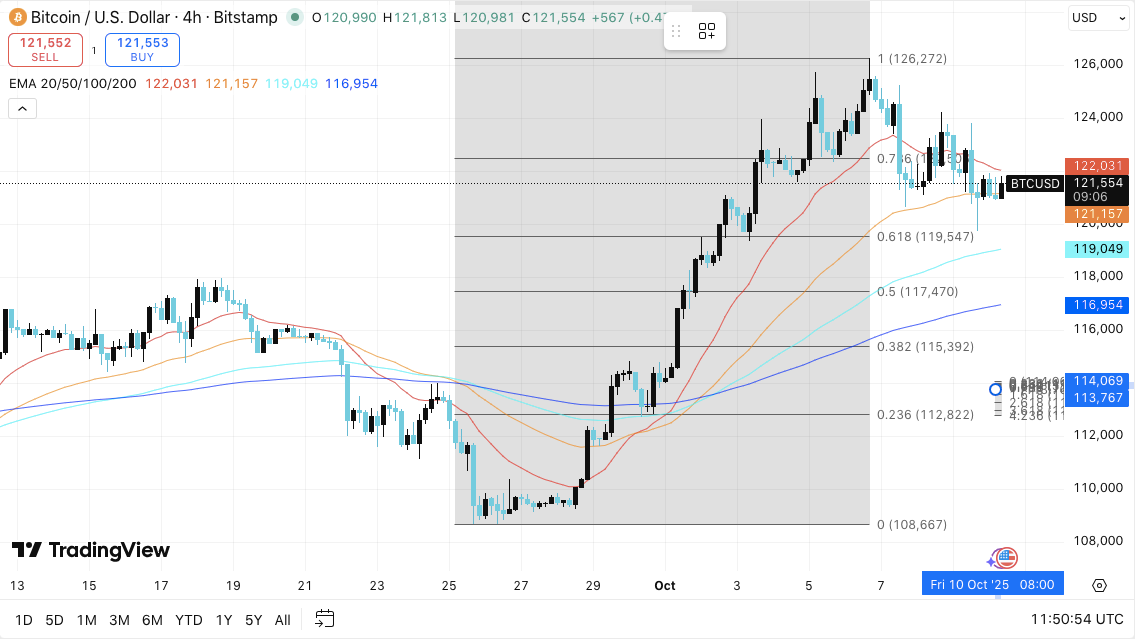
However, the failure to stay above $126,000 has created a short-term lower high, indicating potential exhaustion. Immediate resistance lies around the 20-EMA at $122,031, followed by $122,774. A decisive breakout above $123,000 could reignite bullish momentum toward $126,272 and beyond. Conversely, a drop below $119,500 could extend the correction to $117,470 and possibly $115,392, where the 200-EMA provides dynamic support.
Related: XRP Price Prediction: Analysts Caution As Whale Selling And Derivative Flows Cap Upside
Open Interest and Futures Data Signal Mixed Sentiment
Bitcoin futures open interest has climbed to $90.24 billion, the highest since the current bull cycle began. This surge indicates increased speculative activity and leveraged participation. Both institutional and retail traders are expanding exposure, suggesting growing market confidence despite recent volatility.
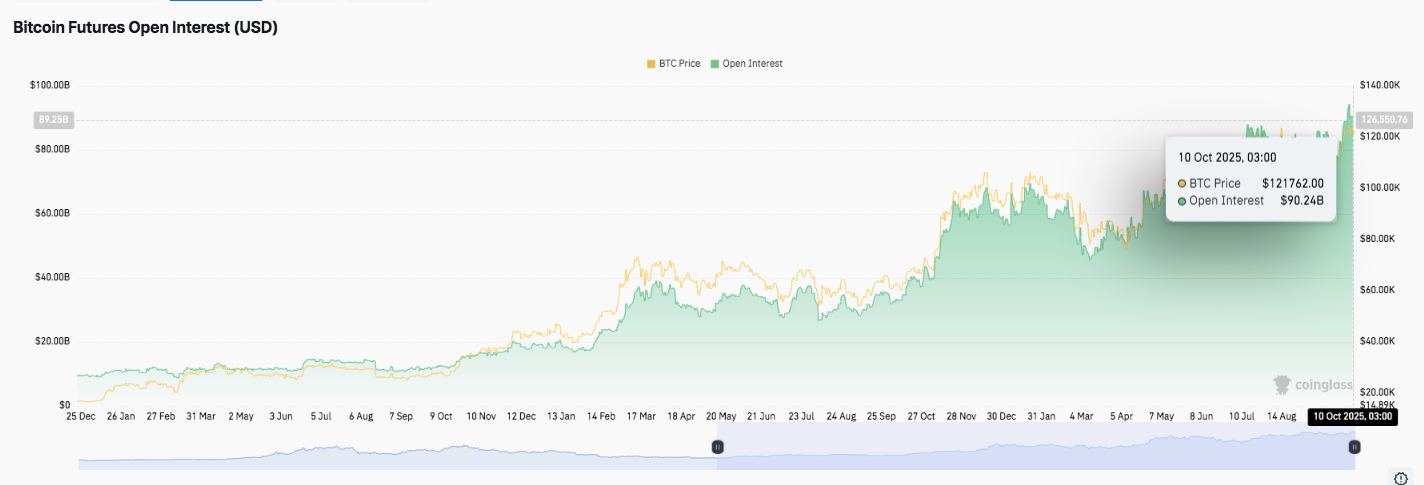
Moreover, open interest has risen alongside price movements, reflecting traders’ willingness to take directional bets. Still, such buildup often precedes heightened volatility when positions unwind. If Bitcoin struggles to hold above $120,000, liquidations could amplify price swings, especially in leveraged environments.
Spot Flows Reveal Outflows and Profit-Taking
Spot netflows of Bitcoin are not stable, with alternating inflows and outflows up to 2025. Exchanges experienced a net outflow of $119.71 million on October 10 when the token traded at approximately $121,600. Continued outflows since late September indicate that investors are cashing profits after the new all-time highs.
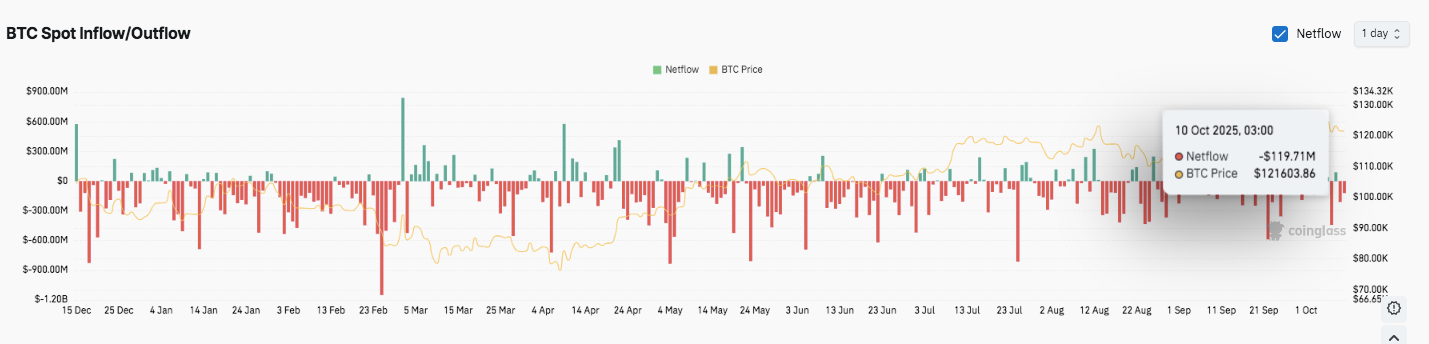
In previous months, brief inflow spikes above $600 million coincided with recoveries. However, the ongoing outflow pattern now signals cooling market momentum. Historically, such phases have preceded consolidation periods before major trend reversals or continuations.
Veteran Trader’s Massive Short Adds to Caution
Adding to market tension, an early Bitcoin holder placed a $438 million leveraged short on the decentralized exchange Hyperliquid. The trade involves 3,600 BTC, with a liquidation threshold at $139,900. This move reflects a calculated expectation of short-term downside, possibly a hedge after earlier spot sales.
According to lookonchain data, the same entity sold 3,000 BTC this week and more than 35,000 BTC last month, allegedly working some of the capital into Ethereum. This kind of action emphasizes strategic diversification, but is not pure bearishness, and still serves to breed caution in traders.
Related: Ethereum Price Prediction: ETF Flows Turn Mixed As BlackRock Accumulates
Technical Outlook for Bitcoin Price
Critical levels are also clear with Bitcoin holding around $121,550 after being rejected at the last high of about $126,272. The 4-hour chart indicates that the pullback is close to Fibonacci retracement levels and major moving averages.
- Upside levels: $122,774 (0.786 Fib) and $123,000 as immediate resistance, followed by $126,272 (recent high) as the major hurdle. A breakout above this range could propel Bitcoin toward $128,500 and $130,000.
- Downside levels: Immediate support lies at $121,150–$119,500 (0.618 Fib), followed by $117,470 (0.5 Fib) and $115,392 (0.382 Fib). The 200-EMA near $116,954 serves as a strong dynamic base for the broader uptrend.
- Resistance ceiling: The $122,000–$123,000 zone remains the critical region to flip for a renewed bullish impulse. Sustained trading above this area could restore momentum and encourage further accumulation.
The technical setup indicates Bitcoin is consolidating within a tightening range, suggesting volatility compression before the next decisive move. The broader trend remains constructive as long as the price holds above $119,500.
Will Bitcoin Extend Its Rally?
The short-term trend of Bitcoin will be determined by the ability of the bulls to hold the support at $119,500 until they can retest the support at $123,000. A rise above this level would rejuvenate the pace to $126,272 and higher, backed by strong futures open interest and consistent ETF inflows. On the other hand, inability to maintain over $119,000 can initiate a correctionary period to $117000.
Related: Dogecoin Price Prediction: Traders Eye $0.30 Target as DOGE Consolidates Again
Disclaimer: The information presented in this article is for informational and educational purposes only. The article does not constitute financial advice or advice of any kind. Coin Edition is not responsible for any losses incurred as a result of the utilization of content, products, or services mentioned. Readers are advised to exercise caution before taking any action related to the company.


