


- BTC spot ETFs lost $331.05M on May 19 and $648.64M the prior day, with two consecutive weeks of nearly $1B in net outflows
- Benjamin Cowen flagged the 200-day MA rejection as matching the exact setup from 2018 and 2022, arguing stablecoin dominance confirms the bear market is not over
- Ali Charts flagged the MVRV ratio dropping below its 180-day SMA as a historically high-conviction accumulation zone for long-term buyers
Bitcoin trades at $76,818 on May 20, dropping below $77,000 as spot ETFs shed nearly $1B across two sessions, stablecoin dominance holds its breakout structure, and analysts split sharply on whether this is a bear market continuation or a deep accumulation setup.
Bitcoin Daily Chart: Below the 0.618 Fib With CMF Barely Positive
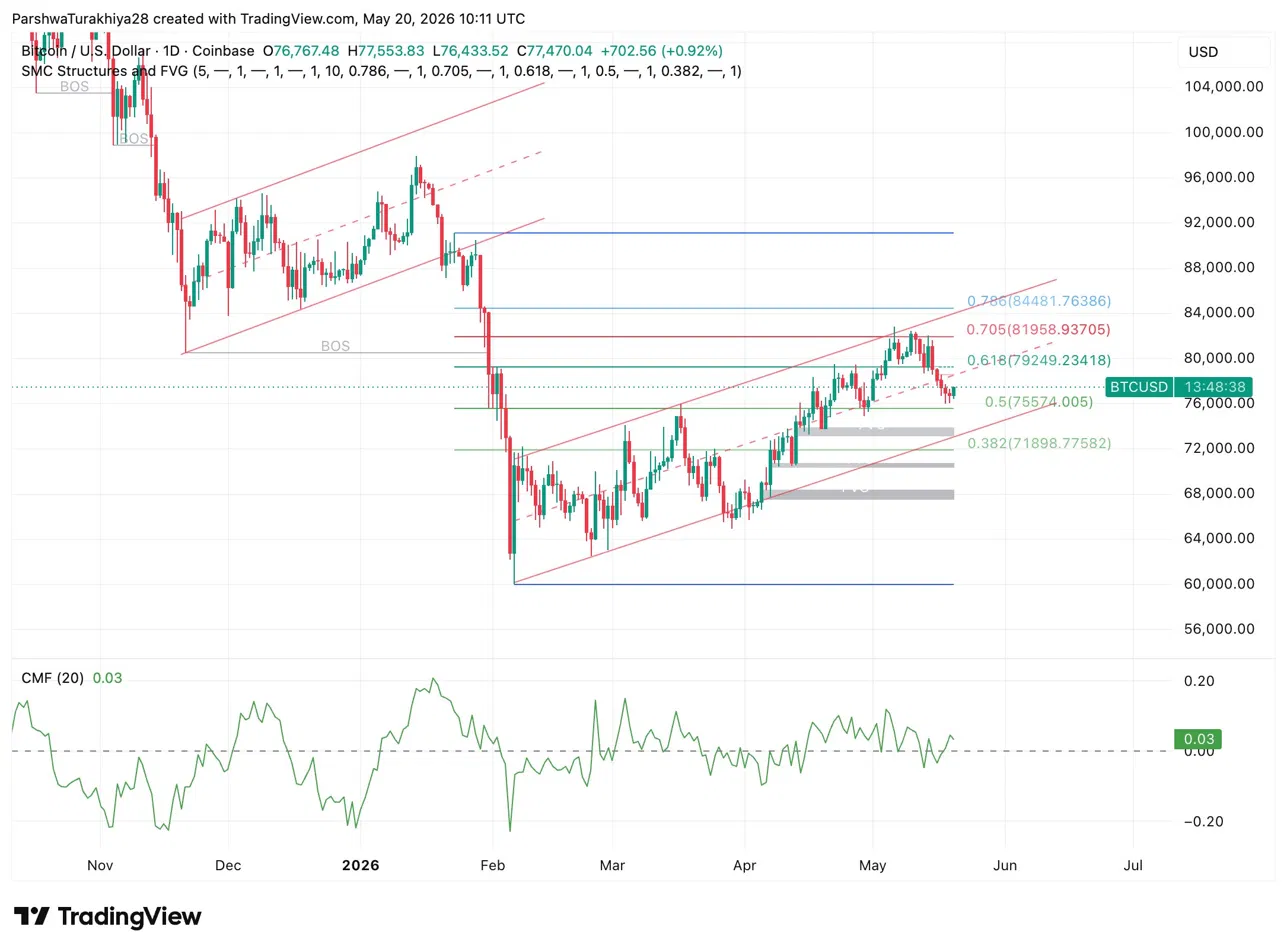
BTC price broke the ascending channel that guided recovery from the April lows and has since lost the 0.618 Fib at $79,249 and the 0.705 Fib at $81,958. Both levels now act as resistance overhead. The 0.5 Fib at $75,574 is the nearest support below current price, with three FVG zones stacking between $68,000 and $72,000 below that.
The CMF sits at 0.03, barely positive after spending most of the past two weeks in negative territory. That reading means money flow is near neutral, neither accumulating nor distributing aggressively at current levels. A sustained move above zero on CMF while price holds $75,574 would be the first constructive signal since the May 11 rejection.
Related: Ethereum Price Prediction: 60 Whales Exit the Network as ETH Sentiment Hits 2023 Bear Market Lows
The ascending channel from the April lows is broken. Price is now trading in open space between the 0.5 and 0.618 Fibs, with no structure to guide the next move until one of those levels gives a clear daily close reaction.
BTC Key levels for May 21:
- Resistance: $79,249 (0.618 Fib), $81,958 (0.705 Fib), $84,481 (0.786 Fib)
- Support: $75,574 (0.5 Fib), $71,898 (0.382 Fib), $68,000 to $72,000 FVG cluster
- CMF: 0.03, near neutral
Bitcoin MVRV Ratio Drops Below 180-Day SMA: What It Means for Price
Ali Charts flagged the MVRV ratio slipping below its 180-day SMA, a level that historically marks where long-term buyers build positions.
When MVRV sits below that line, BTC is pricing at a discount to its realized value. Prior cycles show this zone preceding major accumulation phases rather than further breakdowns. Whether that plays out here depends on ETF outflows stabilizing and $75,574 holding on a daily close.
Bitcoin Spot ETF Outflows: $1B Gone in Two Days, $2B in Two Weeks
May 19 recorded $331.05M in outflows. May 18 recorded $648.64M. The prior week ending May 15 saw $979.69M leave, making it back-to-back weeks of approximately $1B in net outflows. BlackRock’s IBIT led on May 19 with $325.58M out, Fidelity’s FBTC added $1.67M, Valkyrie’s BRRR added $3.79M.
Cumulative inflows across all products remain at $57.36B but total net assets dropped to $100.29B from a peak above $109B earlier this month. Two consecutive weeks of $1B outflows represent sustained institutional de-risking, not a single session anomaly.
Why Cowen Still Thinks This Is a Bear Market?
Cowen tracks USDT plus USDC dominance combined as a risk gauge. When it rises, capital is sitting in stablecoins rather than deployed into crypto. The base he references built for over two years before breaking out. Breakouts from bases that wide do not reverse in weeks.
He maps the current structure across four points: breakout above the base, pullback to the breakout level, recovery rally, then a second pullback to the 21-week EMA. That fourth point is where stablecoin dominance sits now, and it is the exact level where the metric found support in prior cycles before resuming higher.
Related: Solana Price Prediction: Goldman Sachs Dumps SOL ETFs as Funding Rates Turn Negative
The direct comparison is Bitcoin dominance from 2019 to 2021. Every altseason call during that period failed. Dominance kept climbing regardless. Cowen also points to BTC getting rejected at the 200-day MA, which happened in both 2018 and 2022 at the same stage of those bear markets. In 2018, a low in February, a higher low in April, and a 200-day MA tag in May preceded a June low that swept below February. The current sequence matches that order exactly.
Bitcoin Price Prediction for May 20th 2026
- Upside: MVRV below the 180-day SMA historically marks where accumulation builds. If ETF outflows slow and BTC holds $75,574, the 0.5 Fib, a base forms before any recovery attempt. Weekly outflows shrinking next session would be the first signal that selling pressure is easing.
- Downside: Cowen’s 2018 analogy targets a June low that sweeps the February lows at $60,000. Weekly ETF outflows continuing at $1B pace and the 200-day MA acting as confirmed resistance both support that path. A daily close below $75,574 opens the FVG cluster between $70,000 and $72,000.
Disclaimer: The information presented in this article is for informational and educational purposes only. The article does not constitute financial advice or advice of any kind. Coin Edition is not responsible for any losses incurred as a result of the utilization of content, products, or services mentioned. Readers are advised to exercise caution before taking any action related to the company.
 Price Prediction 2026, 2027, 2028, 2029, 2030 -2050")


