

- Bitcoin price prediction stays bullish above $78,000, targeting $87,400 first and $90,000 next
- Bitcoin ended October higher in 10 of the last 15 years, with a median gain of 11.2%
- CryptoQuant estimates spot demand has shrunk by about 170,000 BTC over the past 30 days
Bitcoin price prediction for October stays bullish above $78,000, the level BTC needs to hold to keep its August breakout intact.
Bitcoin Price Analysis: Can BTC Hold Its August Breakout Into October?
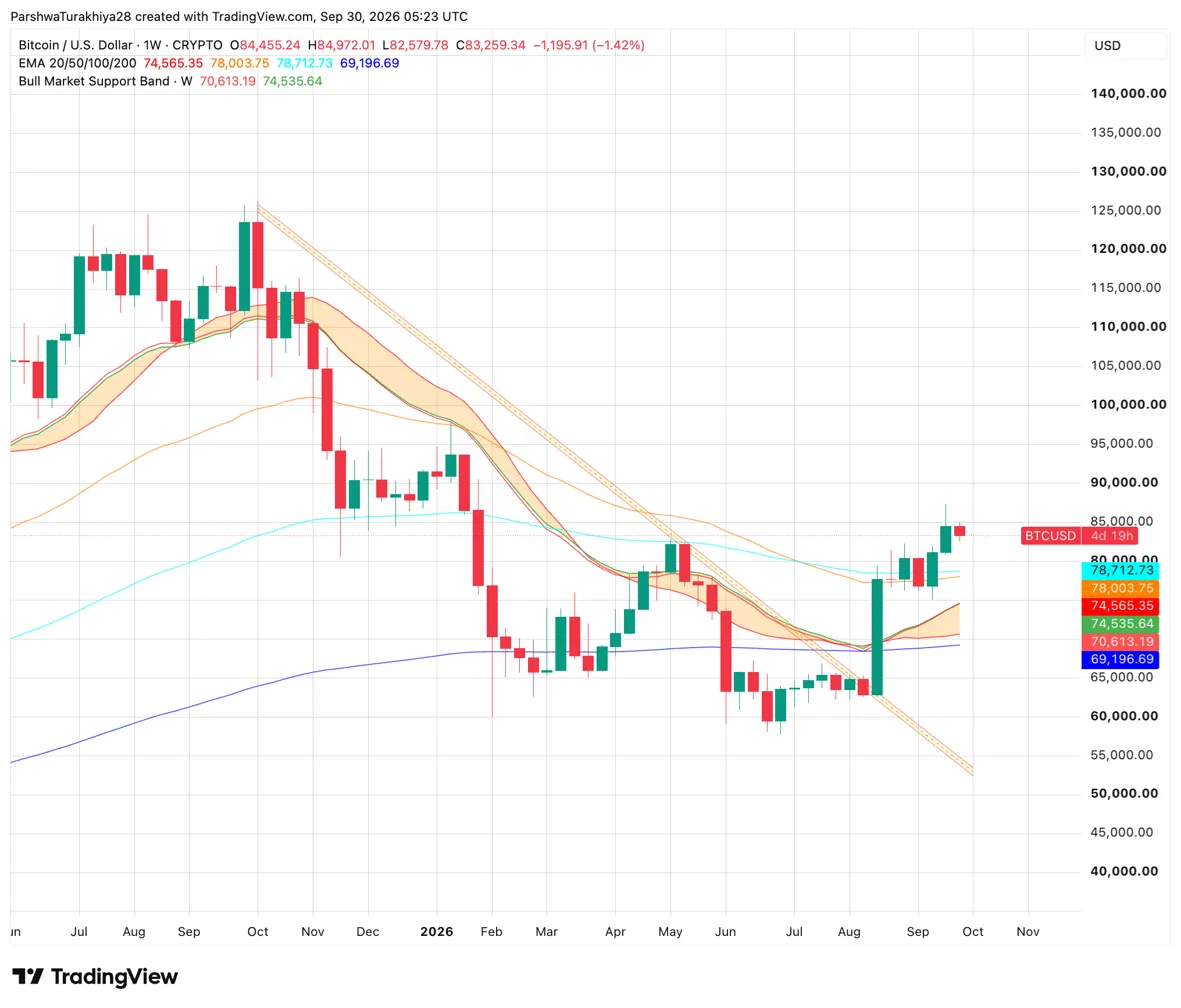
BTC is holding its August breakout, trading near $83,259.34 and still above all four major weekly moving averages despite a 1.42% dip this week. The breakout cleared a descending trendline that had capped price since the October 2025 peak above $125,000, and the pullback from the $87,400 high hasn’t damaged that structure.
The first cushion is the 100-week exponential moving average (EMA), a trend line that weights recent prices more heavily, at $78,712.73, with the 50-week EMA at $78,003.75 just below it. Both sit about 5% to 6% under price. Further down, the 20-week EMA at $74,565.35 sits inside the Bull Market Support Band, a zone traders use to judge whether a bull trend is intact, which spans $70,613.19 to $74,535.64. The 200-week EMA at $69,196.69 sits below the band.
This week’s candle opened at $84,455.24 and peaked at $84,972.01, so a weekly close above that high would signal the pullback is over.
Bitcoin Price Analysis: The 4-Hour Chart Shows a Second Descending Channel
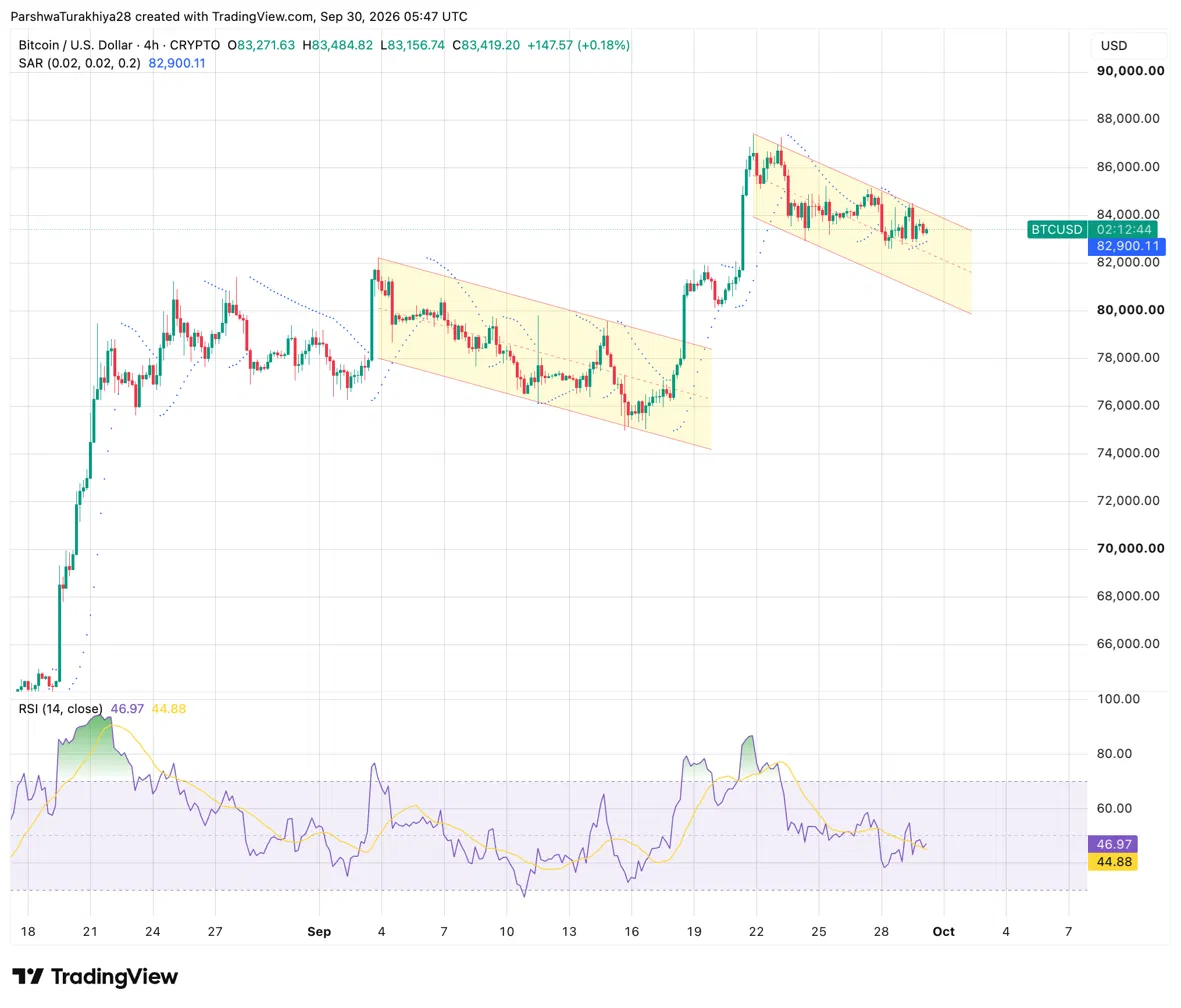
On the 4-hour chart, BTC has drifted lower inside a descending channel, a pair of downward-sloping lines that contain price, since the high near $87,400 around September 22. The channel now spans roughly $80,000 to $84,000. The same shape formed earlier in September, when a channel that began on September 4 resolved to the upside around September 18, and a 4-hour close above the current channel’s upper edge would repeat that pattern.
RSI, a 0 to 100 gauge of how stretched a move is, has cooled to 46.97 from above 80 at the late-September peak and sits just above its moving average at 44.88. The Parabolic SAR, a trend tool that places dots below price in uptrends and above it in downtrends, sits at $82,900.11 beneath price, so the short-term trend still leans up.
BTC Support and Resistance Levels, October 2026
| Type | Price |
| Resistance | $84,972 |
| Resistance | $87,400 |
| Resistance | $90,000 |
| Support | $82,900 |
| Support | $80,000 |
| Support | $78,713 |
Bitcoin October Seasonality: Ten Gains in 15 Years
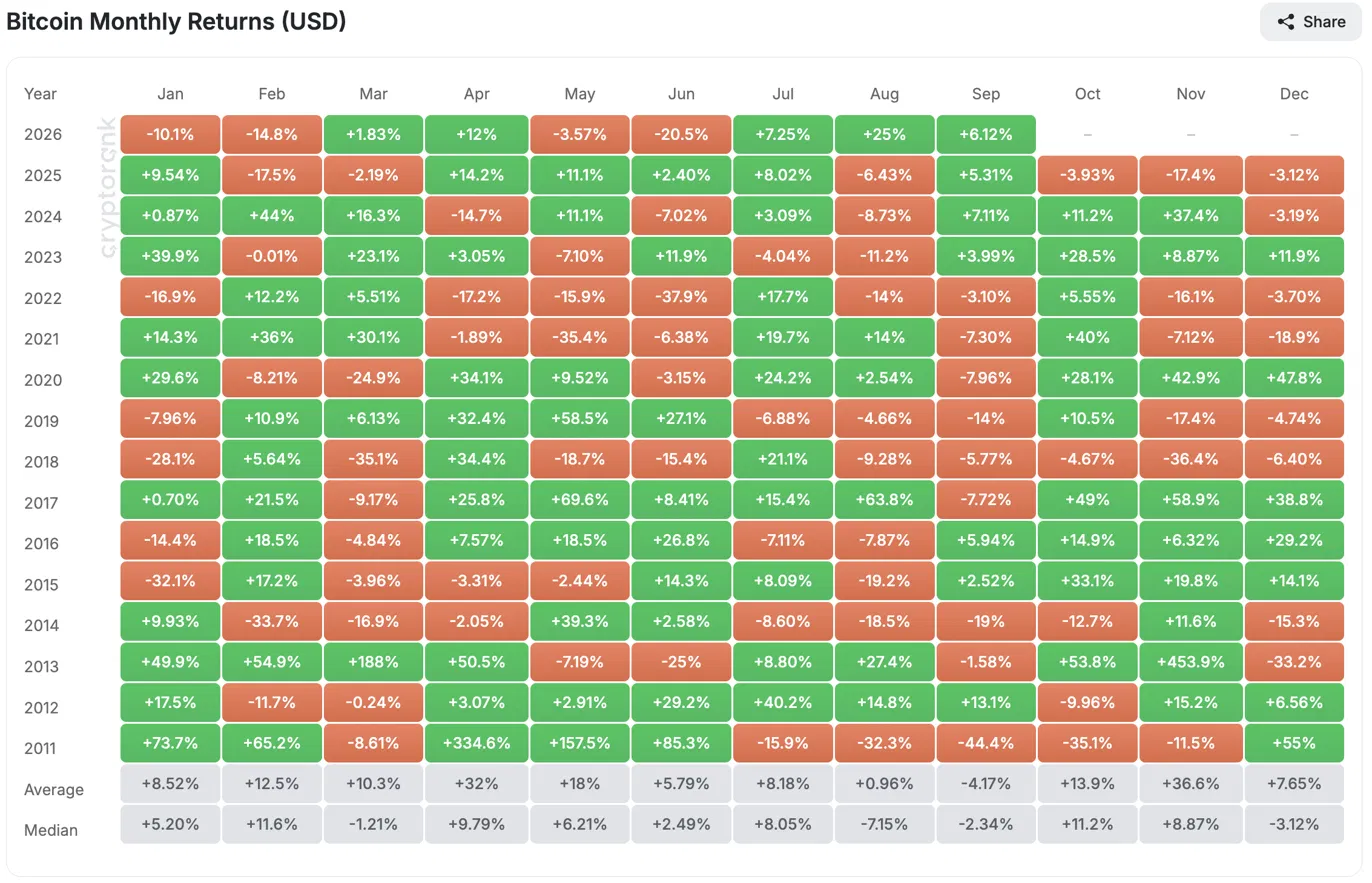
Bitcoin has closed October higher in 10 of 15 years from 2011 through 2025, with an average return of 13.9% and a median of 11.2%. The median is the better guide, since the average is lifted by outsized years such as the 53.8% gain in 2013 and the 49% gain in 2017, and pulled down by a 35.1% drop in 2011.
The recent record is strong but not uniform, with five straight October gains from 2020 to 2024 followed by a 3.93% decline in 2025. This year adds a twist, because September has the only negative average of any month at 4.17%, yet BTC is up 6.12% in September 2026 so far. Applied to a starting price near $83,400, the median October gain implies about $92,700 and the average implies about $95,000, though both are historical references rather than targets.
| Year | October Return |
| 2025 | -3.93% |
| 2024 | +11.2% |
| 2023 | +28.5% |
| 2022 | +5.55% |
| 2021 | +40% |
| 2020 | +28.1% |
| 2019 | +10.5% |
| 2018 | -4.67% |
| 2017 | +49% |
| 2016 | +14.9% |
| 2015 | +33.1% |
| 2014 | -12.7% |
| 2013 | +53.8% |
| 2012 | -9.96% |
| 2011 | -35.1% |
| Average | +13.9% |
| Median | +11.2% |
BTC News: Bitcoin Is Set for Its Best Quarter Since Q4 2024
The Kobeissi Letter reported that Bitcoin is up 43.1% so far in the third quarter, on track for its best quarterly performance since Q4 2024 and its third-best since US spot Bitcoin ETFs began trading in January 2024.
It said BTC has gained 29.8% since August 19, the day the US Treasury said it would increase buybacks of long-dated Treasuries. The publication concluded, “Crypto is in a new bull market,” which is its own read rather than a confirmed market signal.
BTC ETF Flows: $2.4 Billion Weekly Inflow Is the Largest Since October 2025
US spot Bitcoin ETFs took in $2.4 billion in the week ending September 25, their largest weekly intake since October 2025, according to The Kobeissi Letter.
Year-to-date flows have climbed to positive $1.0 billion from total outflows of $5.0 billion at the end of July, a swing of about $6 billion in roughly two months.
| ETF Metric | Value |
| Weekly net inflow, week ending Sep 25 | +$2.4B |
| Year-to-date net flows | +$1.0B |
| Net flows at end of July | -$5.0B |
BTC News: CryptoQuant Flags Fading Spot Demand as Bull Score Hits 90
CryptoQuant’s Bull Score, a single reading that combines onchain and market indicators, reached 90 out of 100 after Bitcoin broke above its 365-day moving average last week, CoinDesk’s Shaurya Malwa reported. The firm’s data shows the buying behind that move is already thinning:
- Apparent demand, which compares newly mined coins with changes in coins untouched for a year or more, has fallen by about 170,000 BTC over 30 days, so the market is absorbing fewer coins than are being created.
- Futures demand growth dropped 90% in 15 days, from about 164,000 BTC on September 14 to 16,000 BTC on September 29.
- Recent buyers hold an average unrealized profit of 33%, the widest since December 2024, and they locked in gains on 25,700 BTC on September 22, the largest single day of profit-taking this year.
CryptoQuant head of research Julio Moreno said near-term upside is harder to sustain with spot demand shrinking and futures growth stalling, adding that “without fresh demand, rallies struggle to extend.”
BTC News: October Fed Hike Odds Fall Below 50%
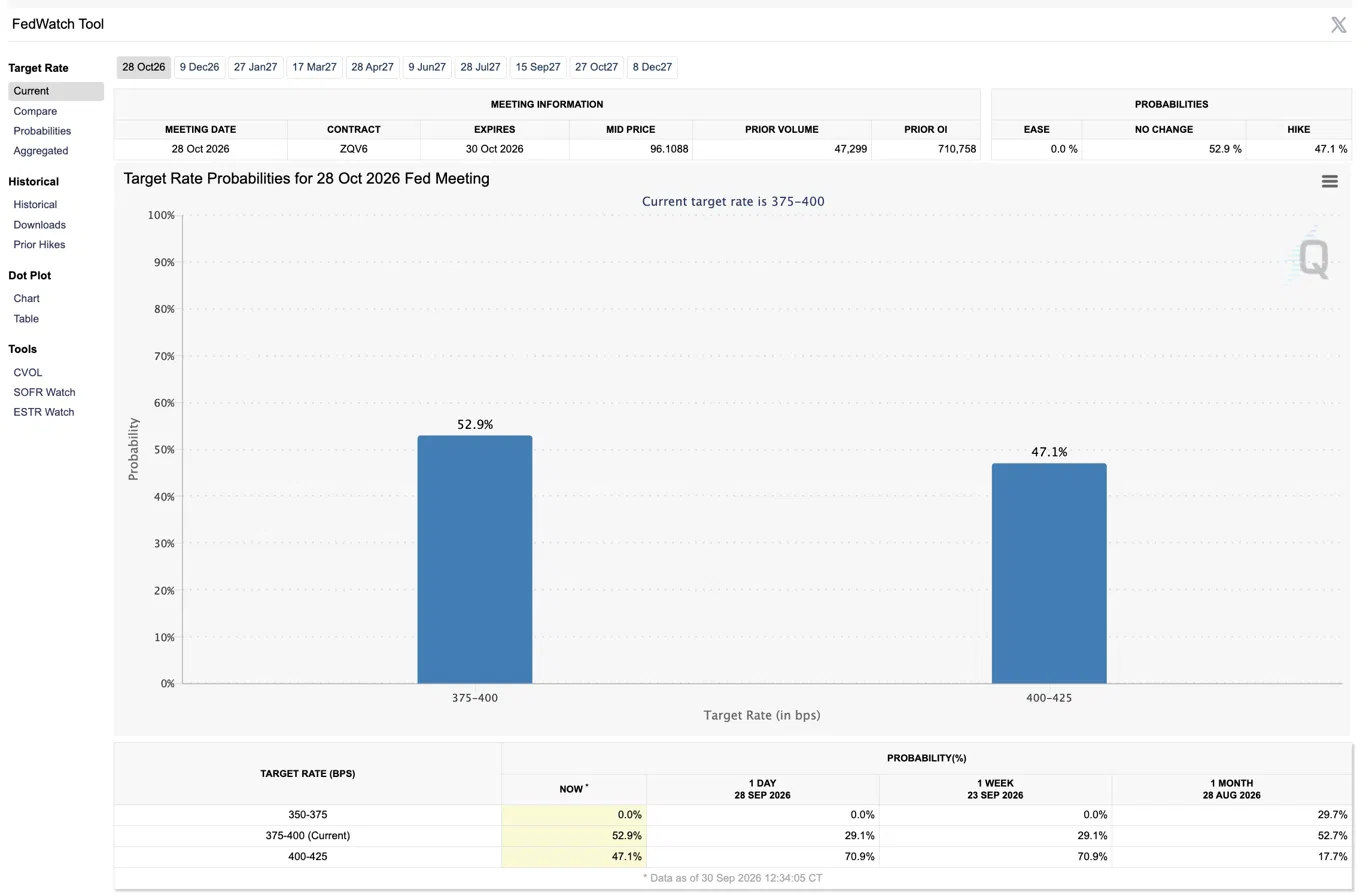
CME FedWatch puts the odds of a quarter-point hike on October 28 at 47.1%, down from 70.9% a day and a week ago, with the other 52.9% on a hold.
The drop followed New York Fed President John Williams saying there is “no need for urgency” after the September hike, though he left room for one more late this year. Fed Governor Michael Barr was firmer, saying more hikes are likely needed, according to Walter Bloomberg on X.
CoinDesk reported that traders are now waiting on a key US inflation reading, where a high print would pressure Bitcoin and a low one would help it.
Bitcoin Price Prediction for October 2026: Week-by-Week Outlook
| Period | Expected Range | Key Levels |
| Oct 1 to 7 | $80,000 to $85,000 | Support at $82,900 and $80,000. A weekly close above $84,972 would end the pullback. |
| Oct 8 to 14 | $82,000 to $87,400 | Reclaiming $84,972 puts the $87,400 high in range, with $82,900 needing to hold on dips. |
| Oct 15 to 21 | $84,000 to $90,000 | A close above $87,400 opens $90,000, while a slip back under $84,000 would mark a failed breakout. |
| Oct 22 to 31 | $82,000 to $92,000 | The October 28 FOMC decision sets the range, with $90,000 as resistance and $80,000 as support. |
Bitcoin Price Prediction: Bullish and Bearish Scenarios for October
Bullish Case, Target: $90,000
BTC holds $80,000, closes above the channel’s upper edge near $84,000, and reclaims the $84,972 weekly high. A weekly close above the $87,400 high opens $90,000, and a soft inflation reading or a patient Fed on October 28 would strengthen the case.
Bearish Case, Risk Level: $78,004 (50-Week EMA)
BTC loses the 4-hour Parabolic SAR at $82,900 and the $80,000 channel floor, then slips under the 100-week EMA at $78,713. A weekly close below the 50-week EMA at $78,004 would expose the 20-week EMA at $74,565 and the top of the Bull Market Support Band at $74,536, a scenario that hotter inflation data or a hawkish October 28 decision would fit.
Bitcoin Price Prediction FAQs
BTC could extend toward $87,400 and then $90,000 in October if it holds above $78,000. A weekly close below the 50-week EMA at $78,004 would put the 20-week EMA at $74,565 in play.
Bitcoin closed October higher in 10 of 15 years from 2011 through 2025, with an average gain of 13.9% and a median of 11.2%. October 2025 was one of the five down years, finishing 3.93% lower.
It is undecided. CME FedWatch shows a 47.1% chance of a quarter-point hike at the October 28 meeting against 52.9% for no change, down from 70.9% for a hike in the tool’s one-day and one-week comparisons.
The evidence is mixed. CryptoQuant estimates spot demand has fallen by about 170,000 BTC over 30 days and futures demand growth has dropped 90% in 15 days, but US spot Bitcoin ETFs took in $2.4 billion in the week ending September 25, according to The Kobeissi Letter.
It is possible but not the base case. BTC would need a gain of about 20% from $83,400 and would have to clear the $87,400 high first. Six of the 15 Octobers since 2011 gained 20% or more, but the median October return is 11.2%, which points closer to $92,700.
Yes, if it loses the $80,000 channel floor on the 4-hour chart. The 100-week EMA at $78,713 and the 50-week EMA at $78,004 are the next supports, and a weekly close under the 50-week would open a move toward $74,565.
Disclaimer: The information presented in this article is for informational and educational purposes only. The article does not constitute financial advice or advice of any kind. Coin Edition is not responsible for any losses incurred as a result of the utilization of content, products, or services mentioned. Readers are advised to exercise caution before taking any action related to the company.