
- BTC Liquidation Heatmap Shows High Leverage Short Positions at Risk.
- Bitcoin’s Price Fluctuations Suggest Potential for More Short Liquidations.
- Social Volume Spikes Indicate Market Sentiment Drives BTC Price Movements.
Bitcoin’s price action has traders on edge as liquidity and volatility show signs of major shifts. Over the past 24 hours, BTC’s price has swung dramatically, creating uncertainty in the market.
The BTC liquidation heatmap reveals concentrated liquidity zones around crucial support and resistance levels. With the market’s volatile swings, highly leveraged short positions seem vulnerable to liquidation. This presents a chance for traders to profit from short-term price changes.
Volatility and Price Action in the Last 24 Hours
Bitcoin’s price has ranged between $59,629 and $60,747 over the past 24 hours, demonstrating considerable volatility. The chart tracks the BTC/USDT and ETH/USDT pairs, with both cryptocurrencies experiencing frequent ups and downs.
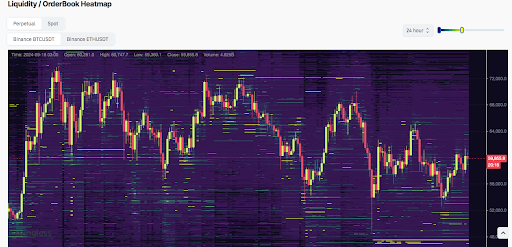
The heatmap shows a dense concentration of liquidity near $56,000 (support) and $64,000 (resistance), suggesting key areas where price reactions are likely. Beyond these levels, the price movements point to frequent buying and selling pressure, with traders quickly responding to price fluctuations.
Read also: Bitcoin’s 15% Rebound Shifts Market Sentiment from Extreme Fear to Neutral
BTC Liquidations: A Market Sentiment Gauge
A key part of the chart is the visualization of Bitcoin liquidations, displaying both long and short positions. The BTC price, currently around $59,746.34, has been moving sideways between $40,000 and $60,000.
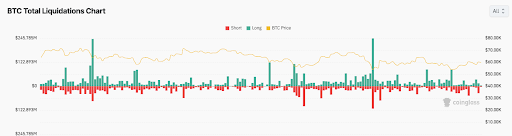
Importantly, a significant short liquidation event happened recently, strengthening the idea that leveraged short positions may soon face liquidation. What’s more, traders are getting liquidated in both directions due to the market’s ongoing volatility, suggesting that any significant price movement could trigger more liquidations.
Social Sentiment Influences BTC Price Trends
Besides liquidation patterns, the chart also highlights the role of social volume and sentiment in Bitcoin’s price swings. As BTC’s price rises and falls, social volume tends to spike, reflecting increased discussions in the market.
Weighted sentiment, which tracks the emotional responses of market participants, has fluctuated between positive and negative values. This correlation between sentiment and price movements suggests that market participants’ emotional reactions may drive Bitcoin’s price.
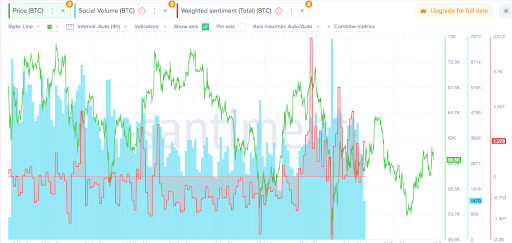
With a current social volume of 1,470 and sentiment at 1.273, traders may expect further volatility as sentiment continues to shape price direction. Significantly, Bitcoin remains up 1.31% over the last 24 hours, with a 24-hour trading volume of over $39 billion.
Disclaimer: The information presented in this article is for informational and educational purposes only. The article does not constitute financial advice or advice of any kind. Coin Edition is not responsible for any losses incurred as a result of the utilization of content, products, or services mentioned. Readers are advised to exercise caution before taking any action related to the company.
 Price Prediction for April 2026: Will Chainlink Move Higher?")
 Price Prediction: Can Bulls Sustain the $0.045 Push?")


