
- Bitcoin trades at $97,314, holding above key support as 20,000 BTC exit long-term holder wallets.
- RSI at 45.64 and MACD bearish, signaling neutral to slight downside momentum unless BTC reclaims $99K.
- Key resistance at $102,400, with a breakout potentially driving BTC toward $108,000 in the near term.
Bitcoin’s market dynamics is experiencing notable fluctuations as over 20,000 BTC have moved out of long-term holder wallets within the past 96 hours.
Historically, such transactions signal potential shifts in investor sentiment, as long-term holders are typically viewed as stabilizing forces in the crypto market. The withdrawal of a substantial amount of Bitcoin raises questions about whether it marks the beginning of a broader trend or isolated selling pressure.
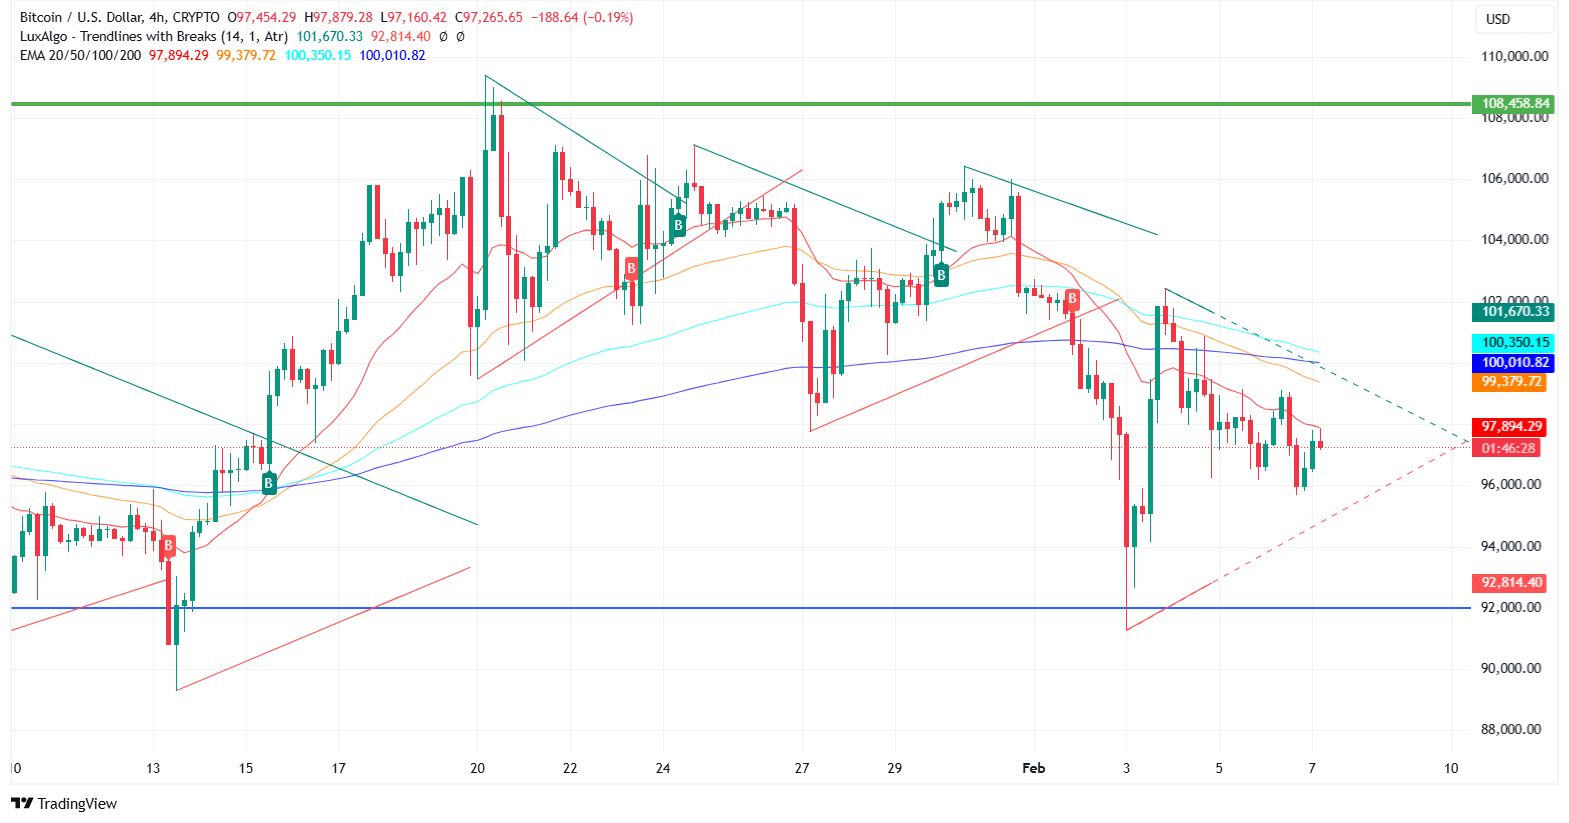
Bitcoin Price: Stuck in a Range
Bitcoin (BTC) is trading at $97,314.78, showing a 0.78% daily gain. It has moved within a narrow range, hitting a 24-hour high of $97,879.28 and a low of $97,160.42. While the market sentiment remains moderately bullish, BTC faces resistance at $102,433.41, with stronger resistance forming near $108,458.84.
If Bitcoin breaks past these levels, a rally could extend further. On the downside, critical support is at $92,814.40, and if that’s broken, BTC could test $91,266.16.
Related: BlackRock CEO “Surprised” by Bitcoin ETF’s Record-Breaking Demand
Technical Indicators: Mixed Signals
The 20-day EMA (that’s the Exponential Moving Average, a measure of the average price over the last 20 days) sits at $97,902.91, recently seeing a bearish crossover, indicating short-term selling pressure. The 50-day EMA at $99,383.27 is a crucial resistance, while the 100-day EMA at $100,351.94 and 200-day EMA at $100,011.72 further define Bitcoin’s trend structure. Currently, BTC is trading below the 50-day and 100-day EMAs, suggesting short-term weakness. However, a move above $99,000 could confirm renewed bullish sentiment.
Momentum indicators reveal neutral to slightly bearish pressure. The Relative Strength Index (RSI) is at 45.64, putting it in a neutral zone, meaning BTC is neither overbought nor oversold. If RSI moves above 50, it could indicate increased buying interest. Meanwhile, the MACD remains in bearish territory, with the MACD line at 49.17 and the signal line at -727.32. A positive MACD histogram shift would signal improving momentum.
Related: BitMEX’s Arthur Hayes Spots Red Flags in Bitcoin Reserve Plan
What’s Next for Bitcoin? Breakout or Pullback?
Bitcoin is approaching a crucial juncture. If BTC reclaims $99,000, the price could extend toward $102,400, with further upside possible beyond $108,000. Conversely, if BTC fails to hold $92,800, a retracement toward $91,200 may follow. The overall trend remains neutral to slightly bearish, but long-term bullish momentum is intact as long as major support levels hold. Traders should closely monitor volume trends and resistance breakouts to assess Bitcoin’s next move.
Disclaimer: The information presented in this article is for informational and educational purposes only. The article does not constitute financial advice or advice of any kind. Coin Edition is not responsible for any losses incurred as a result of the utilization of content, products, or services mentioned. Readers are advised to exercise caution before taking any action related to the company.


