


- Bitcoin faces strong resistance at its 200-day MA, with bulls needing a close above $83K for momentum.
- Price recovery to $81K is underway, but BTC still trades below key long-term trend indicators.
- Liquidation data shows heavier downside risk, though large buy orders near $82K signal demand support.
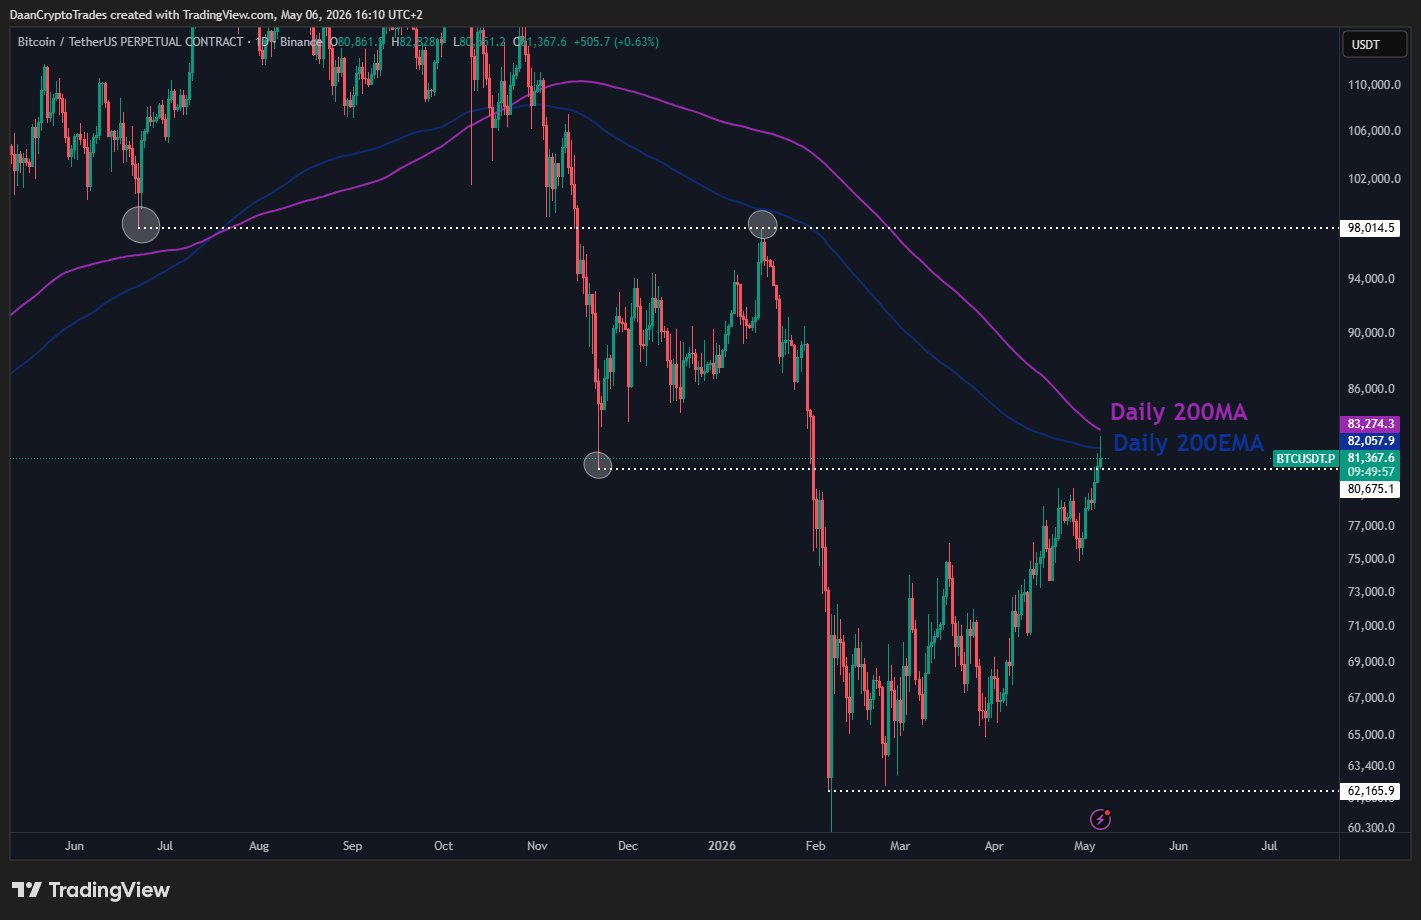
Bitcoin is testing a key resistance level near its 200-day moving average, a zone closely watched by traders. Analyst Daan Crypto Trades said in a post on X that the asset is facing rejection at this level. “$BTC Rejecting from the Daily 200MA/EMA region so far,” he wrote, adding that bulls need a daily close above it to maintain upward momentum.
The cryptocurrency is trading near $81,000 after rebounding from lows around $62,000. However, it remains below the 200-day moving average and the exponential moving average, which often signal long-term trend direction. This leaves Bitcoin at a key point where the next move could shape the short-term outlook.
Source: X
Market Structure Shows Recovery Under Pressure
Earlier, Bitcoin was trading within a range of $90,000-$100,000 before a violent sell-off pushed prices out of the range. This led to the formation of lower highs and lower lows, bringing the market under the bearish influence. Also, Bitcoin had broken its critical moving averages during this period.
Recently, there has been a recovery in Bitcoin’s price, taking it closer to the $80,000 mark. But now, the 200-day moving average and the exponential moving average have become resistance for Bitcoin. It will take a breach of around $83,000 levels for further upside traction.
Wedge pattern and liquidity shape outlook
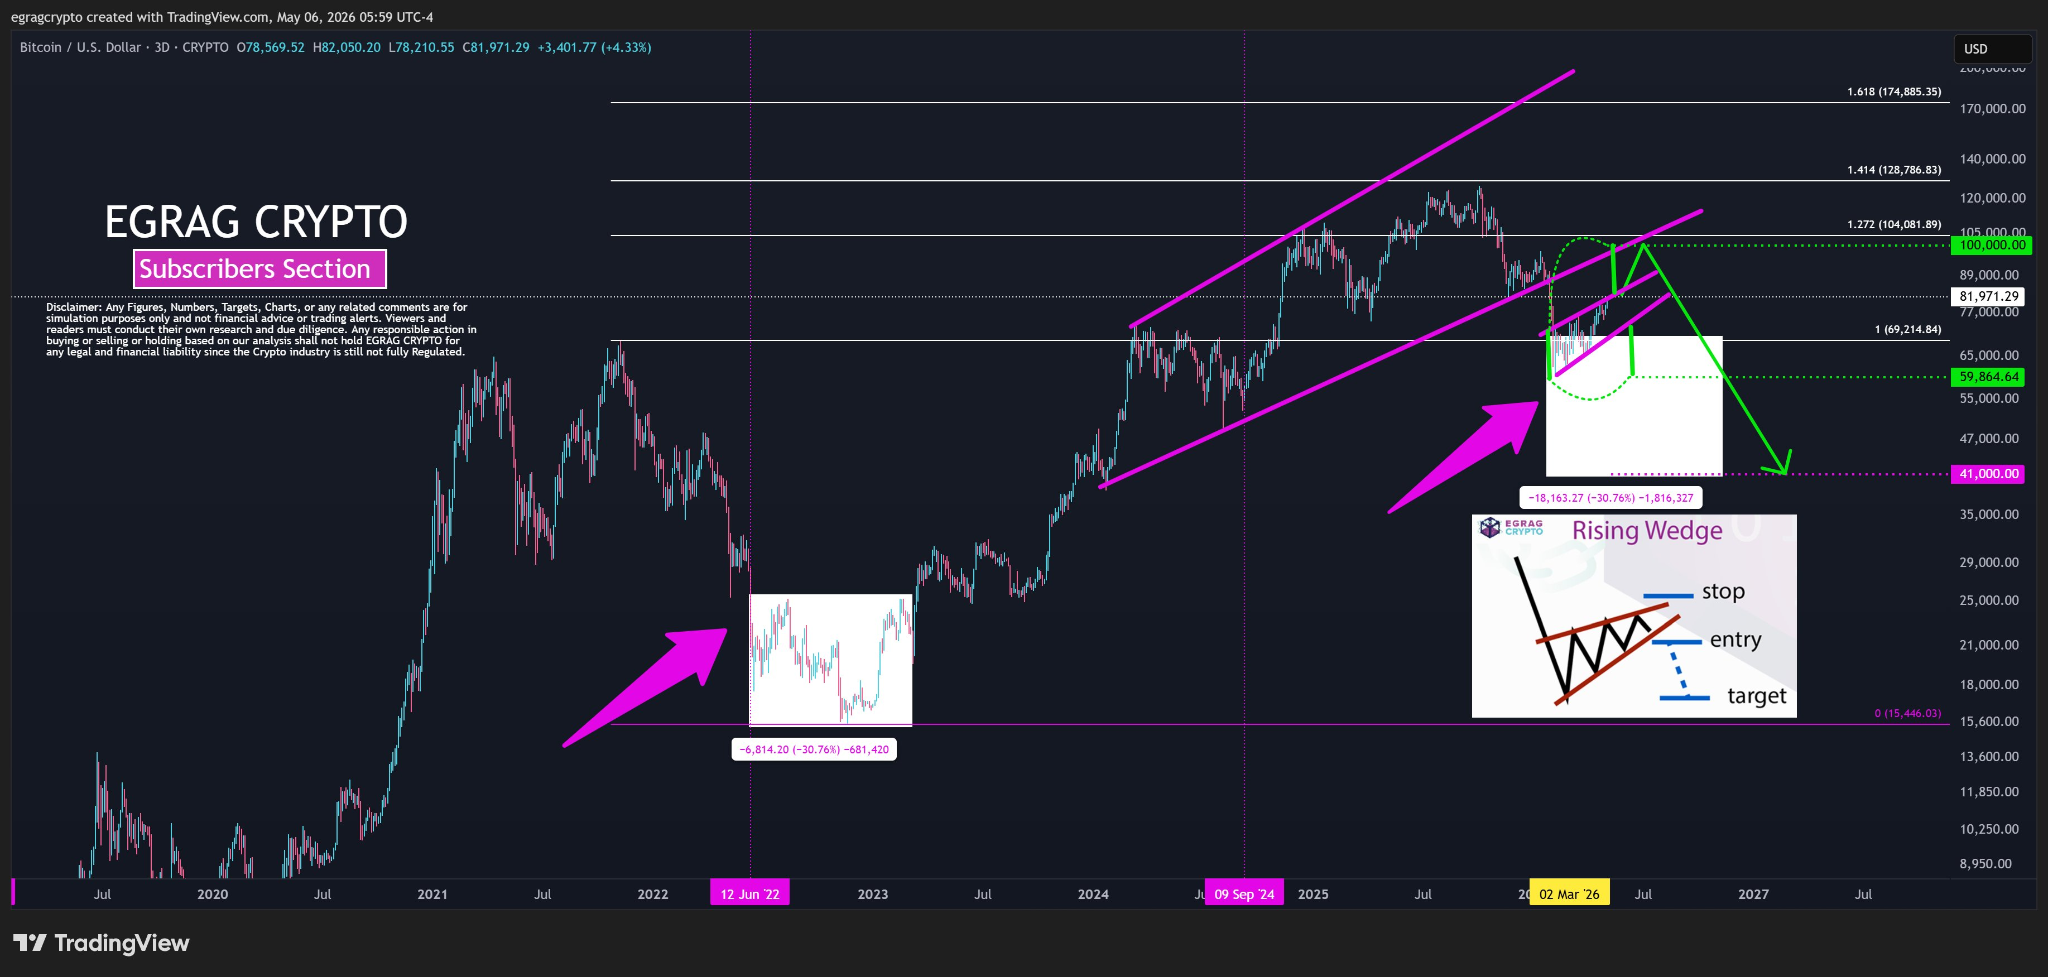
Another analyst, Egrag Crypto, said Bitcoin is forming a rising wedge pattern on higher timeframes. He noted that this setup often precedes a pullback, although prices can still move higher before any breakdown.
“If #BTC breaks out above the wedge with confirmation, the measured move targets: $100K–$104K,” he wrote. He added that a failed breakout could send the price toward $59,000, with deeper losses possible in more volatile conditions.
Source: X
Liquidity data points to uneven positioning in the market. CryptoReviewing newsletter shows short liquidations above $82,000 stand at about $401 million. Meanwhile, long liquidations below current levels exceed $2 billion. This suggests downside risks may be larger if support levels fail.
At the same time, large buy orders have appeared near $82,000, which indicates some demand from bigger traders. However, heavier liquidity below the market is a sign of uncertainty, leaving Bitcoin’s next move closely balanced in the near term.
Related: Peter Schiff Questions Strategy’s Bitcoin Model as Selling Debate Intensifies
Disclaimer: The information presented in this article is for informational and educational purposes only. The article does not constitute financial advice or advice of any kind. Coin Edition is not responsible for any losses incurred as a result of the utilization of content, products, or services mentioned. Readers are advised to exercise caution before taking any action related to the company.


