


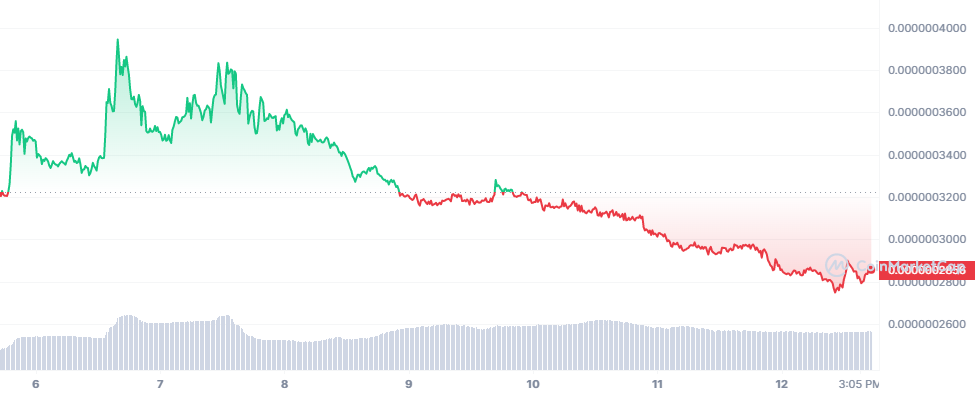
- BRISE is currently trading in the red zone, after trading in the green region at the start of the week.
- BRISE is trading at $0.0000002852, while experiencing a fall of 11.89% in seven days.
- Indicators signal that SOL would recover from its bearish sentiment.
Bitgert’s native token, BRISE is currently trading in the red zone, after trading in the green region at the start of the week. Currently, BRISE is trading at $0.0000002852, while experiencing a fall of 11.89% in seven days. However, trade analysts, reportedly, speculated that Bitgert’s focus on user rewards and tokenomics has shown signs of recovery with potential for many other meme coins in the long term.
The BRISE/USD 1-day chart shows that the candlesticks are giving bearish signals as it is trading in the lower half of the Bollinger Bands. Moreover, the MACD line is below the signal line, which is also considered a bearish signal. However, the Bollinger Bands and the MACD line also show that there could be a recovery point happening soon. For instance, the upper band of the Bollinger Band is stable, while the lower is moving further down. This could be a signal that there could high volatility in the market soon.
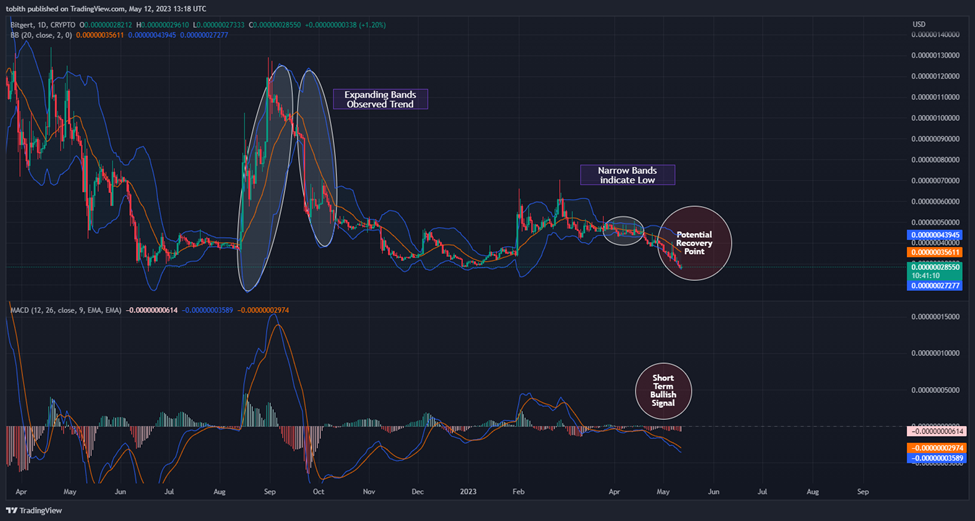
Looking at the previous patterns, there was a trend reversal observed whenever the bands expanded and there is a high possibility that BRISE could jump back into the top half of the Bollinger Bands, which is considered a bullish signal.
Meanwhile, the gap between the MACD line and the signal line is narrow, indicating that a trend reversal may happen anytime. Moreover, the MACD line’s bullish signal is for a short-term period, which further confirms that BRISE could ride with the bulls soon.
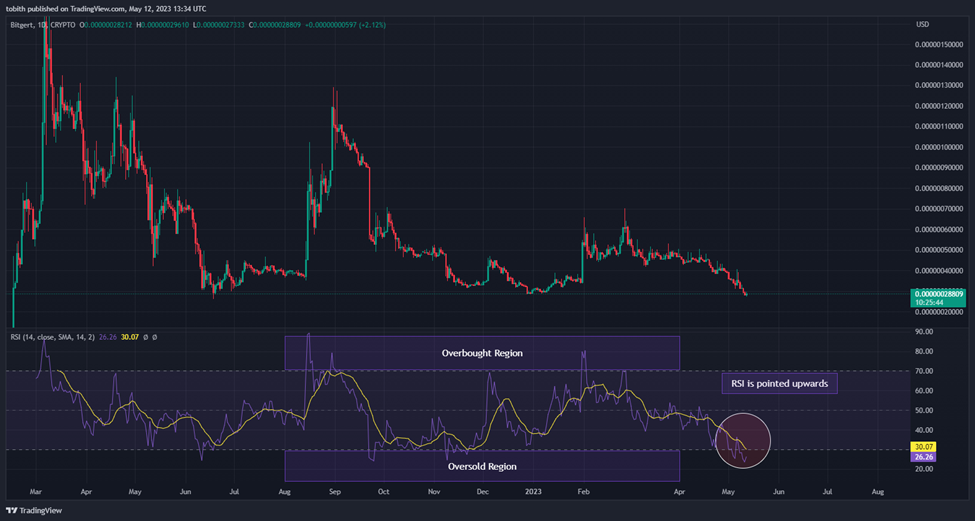
The RSI is currently valued at 26.15, indicating that BRISE is in the oversold region. Even though, the RSI is below the SMA, it is pointed upwards. This is another confirmation that BRISE could recover soon from the overbought region. If the RSI crosses above the SMA, then there is a high possibility that BRISE could remain in the strong trend region between 70 and 50.
Disclaimer: The views and opinions, as well as all the information shared in this price analysis, are published in good faith. Readers must do their own research and due diligence. Any action taken by the reader is strictly at their own risk. Coin Edition and its affiliates will not be held liable for any direct or indirect damage or loss.
Disclaimer: The information presented in this article is for informational and educational purposes only. The article does not constitute financial advice or advice of any kind. Coin Edition is not responsible for any losses incurred as a result of the utilization of content, products, or services mentioned. Readers are advised to exercise caution before taking any action related to the company.
 Price Prediction 2026, 2027, 2028, 2029, 2030-2050")


