


- BLUR’s bearish grip tightens as resistance holds strong.
- A negative Aroon pattern suggests a potential further decline for BLUR.
- Positive CMF and RSI hint at bearish exhaustion, with BLUR price reversal looming.
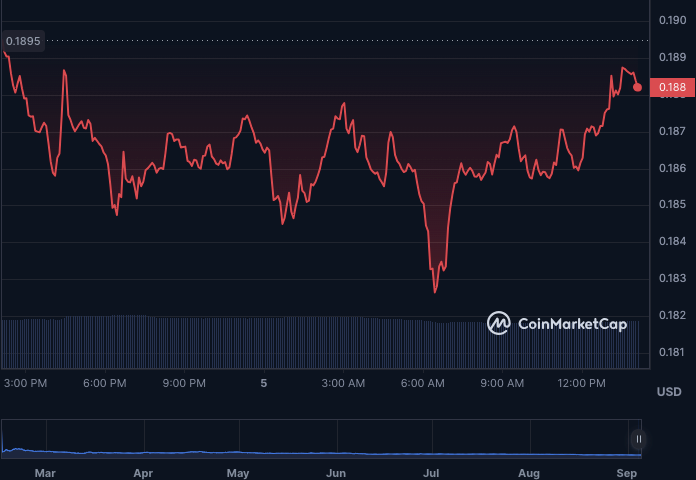
Despite Blur’s (BLUR) positive start to the day, the resistance level around $0.1915 proved firm. As a result, bears took control of the market, with the BLUR price plummeting to an intraday low of $0.1826 before regaining support.
At press time, BLUR was trading at $0.187, down 1.62% from the intraday high. Profit-taking by investors attempting to capitalize on the previous positive trend could account for the negative shift.
During the bear reign, BLUR’s market capitalization and 24-hour trading volume fell by 2.00% and 9.23%, to $167,801,943 and $21,042,294 respectively. If the bearish momentum persists and the $0.1826 support level is surpassed, the next support level to watch is around $0.175. If BLUR can recover bullish momentum and break above the present resistance level of $0.187, it can retest its prior high of $0.195 and continue its upward trajectory.
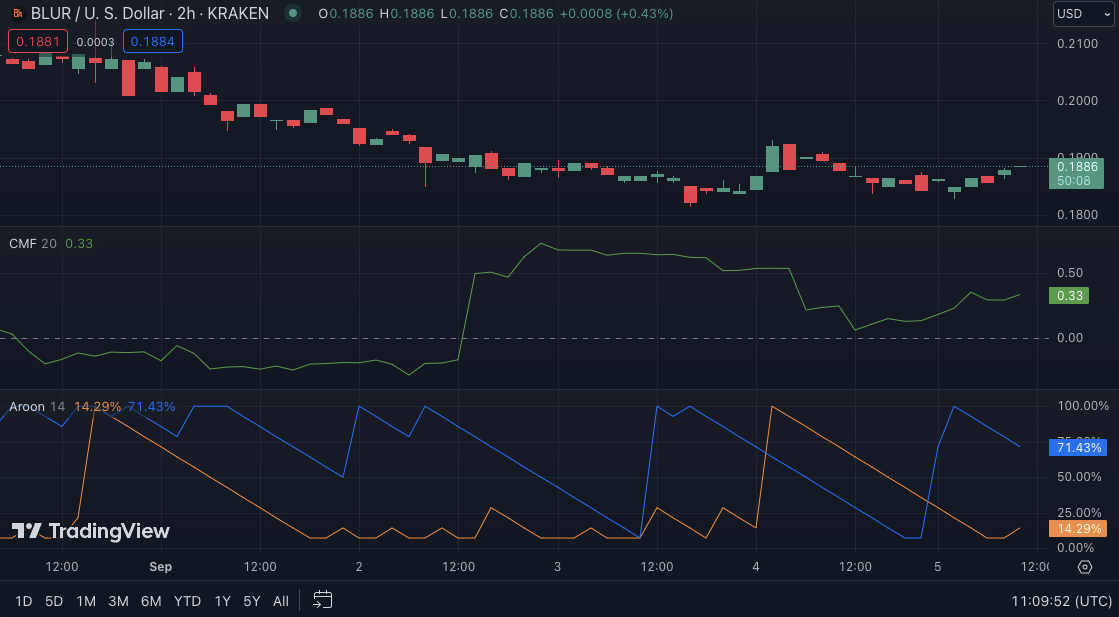
The BLUR’s current trend indicates a strong negative attitude, with the Aroon down reading 78.57% and the Aroon up reading 7.14%. This pattern shows that Blur may see a further decline soon. However, if the Aroon up reading begins to rise and exceeds the Aroon down reading, it may indicate a probable trend reversal and a change toward bullish momentum.
On the other hand, the Chaikin Money Flow (CMF) trend is positive, reading 0.38 and trending higher, indicating buying pressure in the market for Blur. This CMF pattern suggests that demand for Blur may grow, counteracting the pessimistic mood and reversing the downward trend.
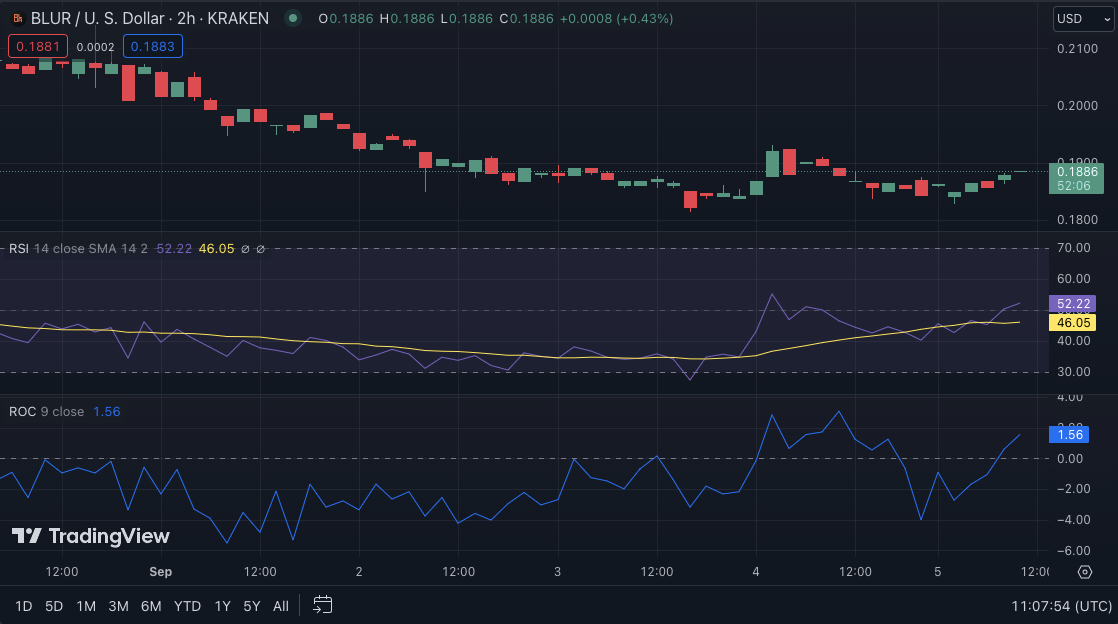
The Relative Strength Index has moved over its signal line on the 2-hour price chart, with a value of 52, suggesting a moderate positive momentum. This trend suggests that there is a possibility of a short-term price increase for Blur as buying pressure starts to outweigh selling pressure.
Furthermore, the Rate of Change (ROC) trending into positive territory with a score of 1.56% indicates that the pace at which Blur’s price moves is increasing, suggesting possible upward momentum. This rise may entice additional buyers and support the probability of a bearish trend reversal.
In conclusion, BLUR’s bear dip could lead to a bullish reversal, backed by contrasting indicators signaling a potential market sentiment shift.
Disclaimer: The views, opinions, and information shared in this price prediction are published in good faith. Readers must do their research and due diligence. Any action taken by the reader is strictly at their own risk. Coin Edition and its affiliates will not be liable for direct or indirect damage or loss.
Disclaimer: The information presented in this article is for informational and educational purposes only. The article does not constitute financial advice or advice of any kind. Coin Edition is not responsible for any losses incurred as a result of the utilization of content, products, or services mentioned. Readers are advised to exercise caution before taking any action related to the company.


