


- Analysis of the BNB price reveals an upward trend with a 0.31% price increase.
- Uncertain price movement is indicated by technical indicators on the 4-hour price chart.
- Bulls restore control and drive prices up to $271.80.
Recent price analysis of BNB on the daily price chart indicates that the bulls are striving to recover control of the market after a sell-off and fall in the previous day. Price support for BNB was around $269.36, and since then, it has increased by 0.31% to $271.80.
While the trading volume has decreased by 8.01% to $530,641,199, the market capitalization has climbed by 0.13% to $43,712,524,833.
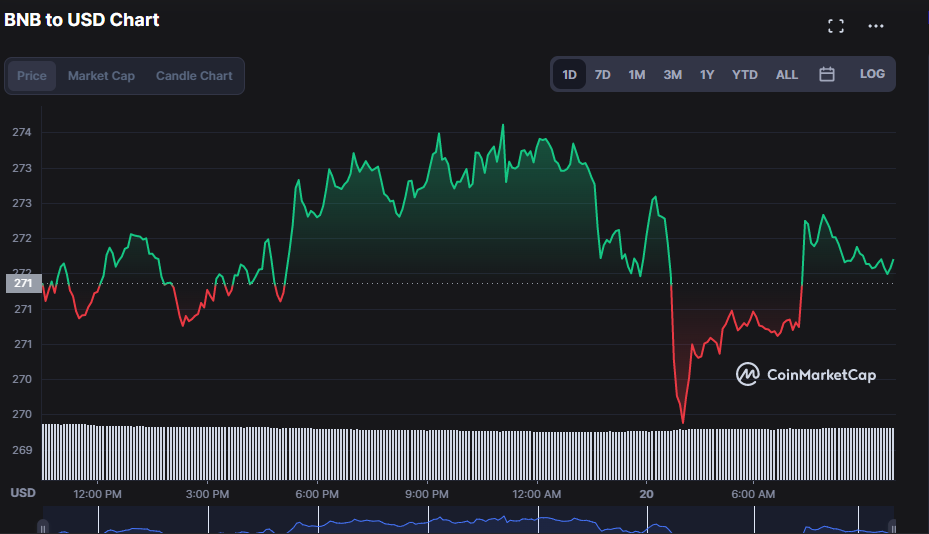
In recent hours, bears had taken control of the market, but the bulls fought back and eventually gained control, driving prices upward.
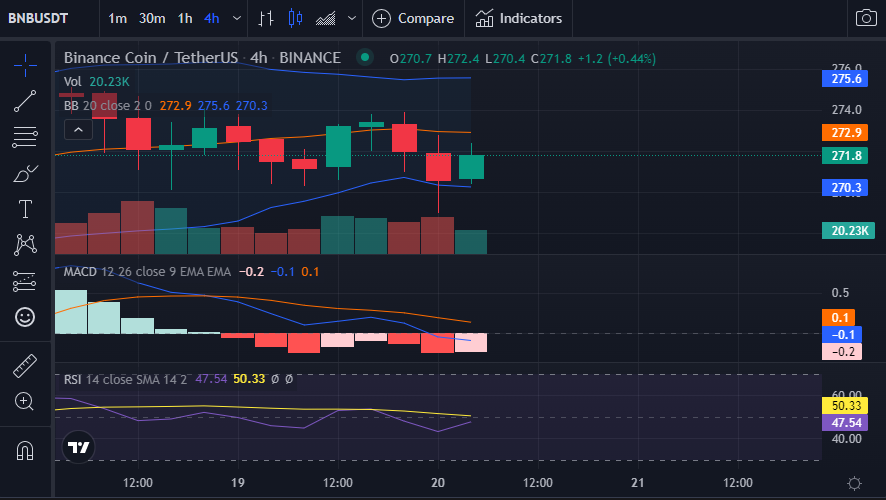
The 4-hour price chart’s expanding Bollinger Bands indicate increasing market volatility. In addition, there is a solid upward tendency in the market’s momentum. In contrast to the top band, which touches 275.6, the lower band touches 270.2.
The RSI has a reading of 47.16 and is pointing north. Additionally, at a reading of 47.16 and rising, the RSI score shows that the market is stable and that the bullish momentum seen on the 4-hour price chart may continue.
The Moving Average Convergence Divergence (MACD), which has a reading of -0.1 and is below the signal line, nevertheless, indicates a bearish trend. If the bulls are successful in holding the resistance level, this MACD negative trend will reverse.
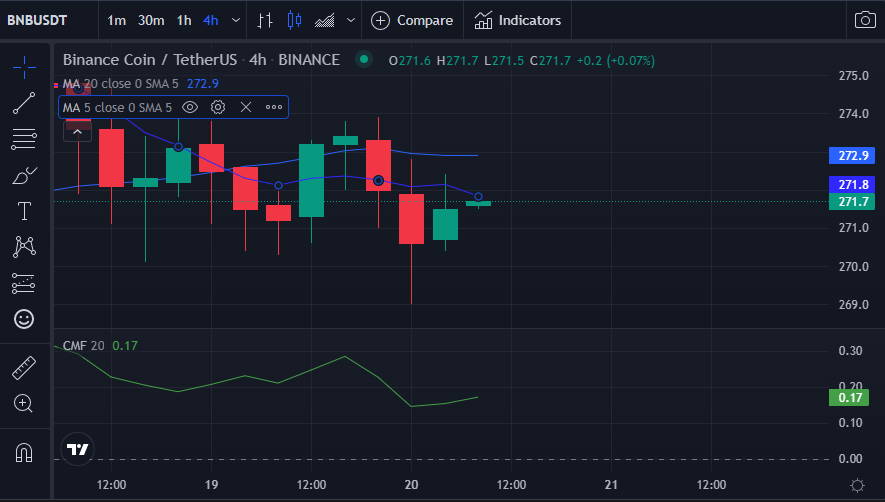
The Chaikin Money Flow (CMF) reading is 0.16. According to this indicator, a value larger than zero and a direction going north indicates a bullish trend.
The moving average shows a bearish crossover despite readings on other indicators, with the longer-term MA crossing over the shorter-term. The 5-day MA hits 271.8, while the 20-day MA touches 272.9.
In general, the bulls are working to maintain the positive momentum while attempting to keep the prices steady.
Disclaimer: The views and opinions, as well as all the information shared in this price analysis, are published in good faith. Readers must do their own research and due diligence. Any action taken by the reader is strictly at their own risk, Coin Edition and its affiliates will not be held liable for any direct or indirect damage or loss.
Disclaimer: The information presented in this article is for informational and educational purposes only. The article does not constitute financial advice or advice of any kind. Coin Edition is not responsible for any losses incurred as a result of the utilization of content, products, or services mentioned. Readers are advised to exercise caution before taking any action related to the company.


