


- After an 8.19% surge over the week, BNB recently escaped from the oversold region.
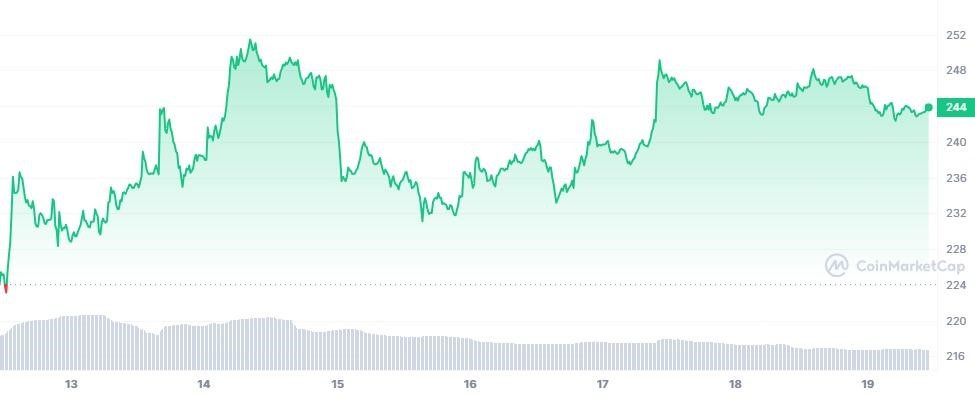
- Currently, BNB is priced at $243.62 after facing a fall of 1.12% in 24 hours
- Indicators confirm that an uptrend recovery may happen for BNB, this week.
BNB continuously trades in the green region after experiencing an 8.19% surge in seven days. However, BNB fell by 1.12% in 24 hours and is priced at $243.62, at the press time. Moreover, the trading volume is valued at $348,412,112, facing an 11.09% fall in just a few days. Will this gradual fall of BNB continue to prevail over the week? Or, will the traders see this slight tumble as an opportunity?
Looking at the BNB/USDT chart, there is a chance that the candlesticks’ current trajectory could lead it into the top half of the Bollinger Band, which is sometimes considered the uptrend region by most traders. Since the candlesticks have touched the lower half of the Bollinger also known as the oversold region, BNB may face price correction.
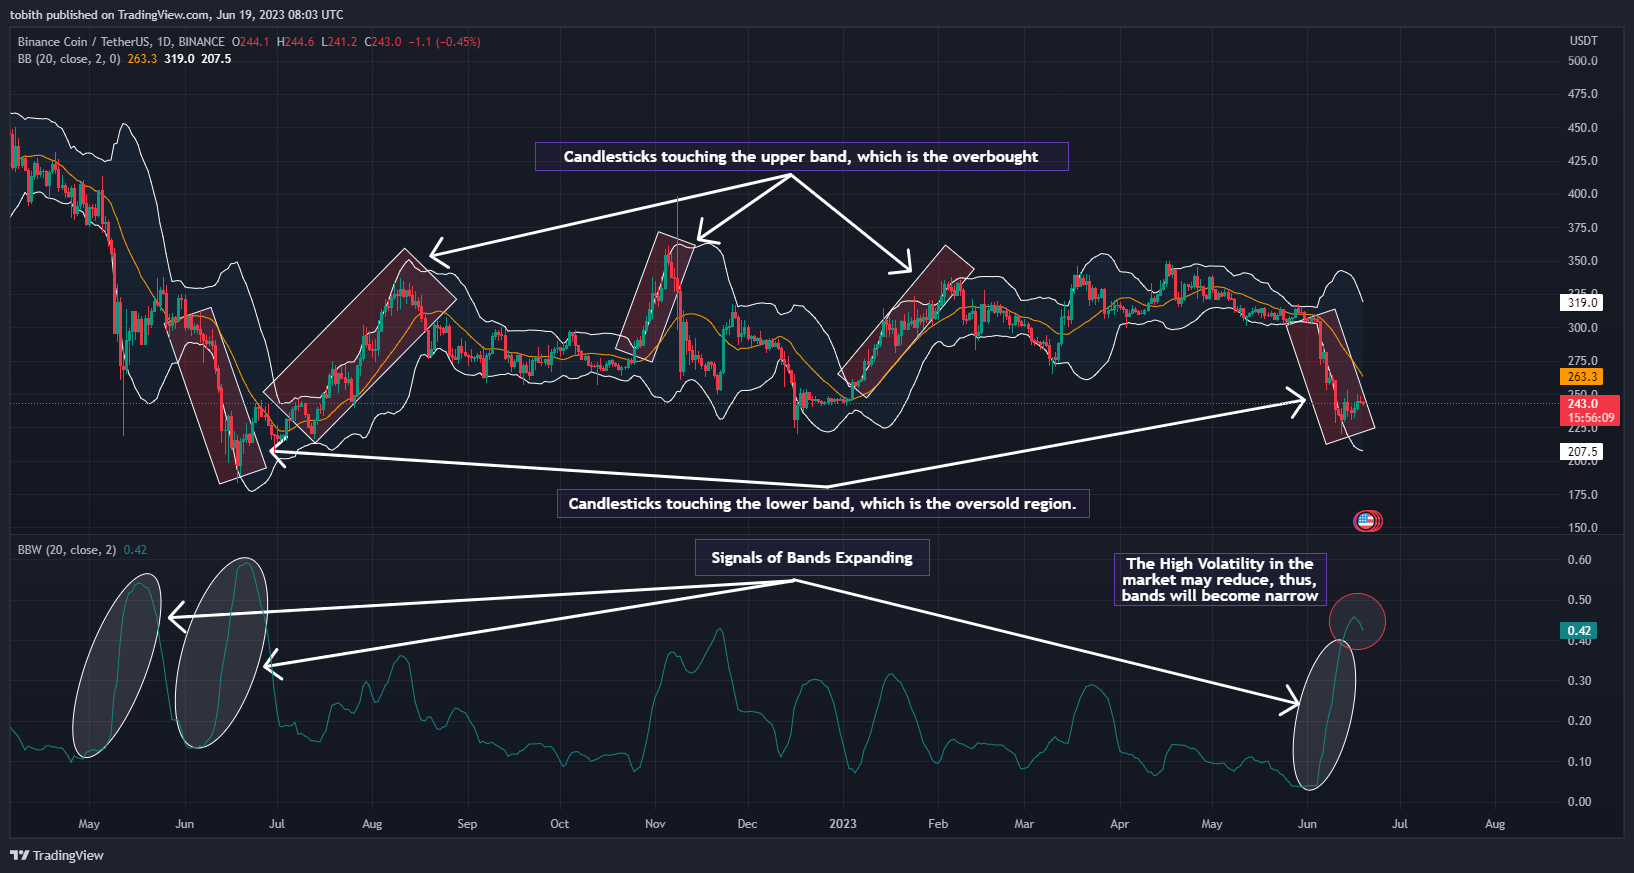
However, there is also a possibility that the candlesticks may continue to remain at the bottom half of the Bollinger Band as the Bollinger Band Width (BBW) indicator signals that the high volatility market may end soon.
The charts also show that BNB experienced a similar situation earlier. Last year in June, when BNB entered the oversold region during the highly volatile market, it witnessed a trend reversal and jump to the top-half region of the Bollinger Band. Traders need to wait for confirmation before entering the market.
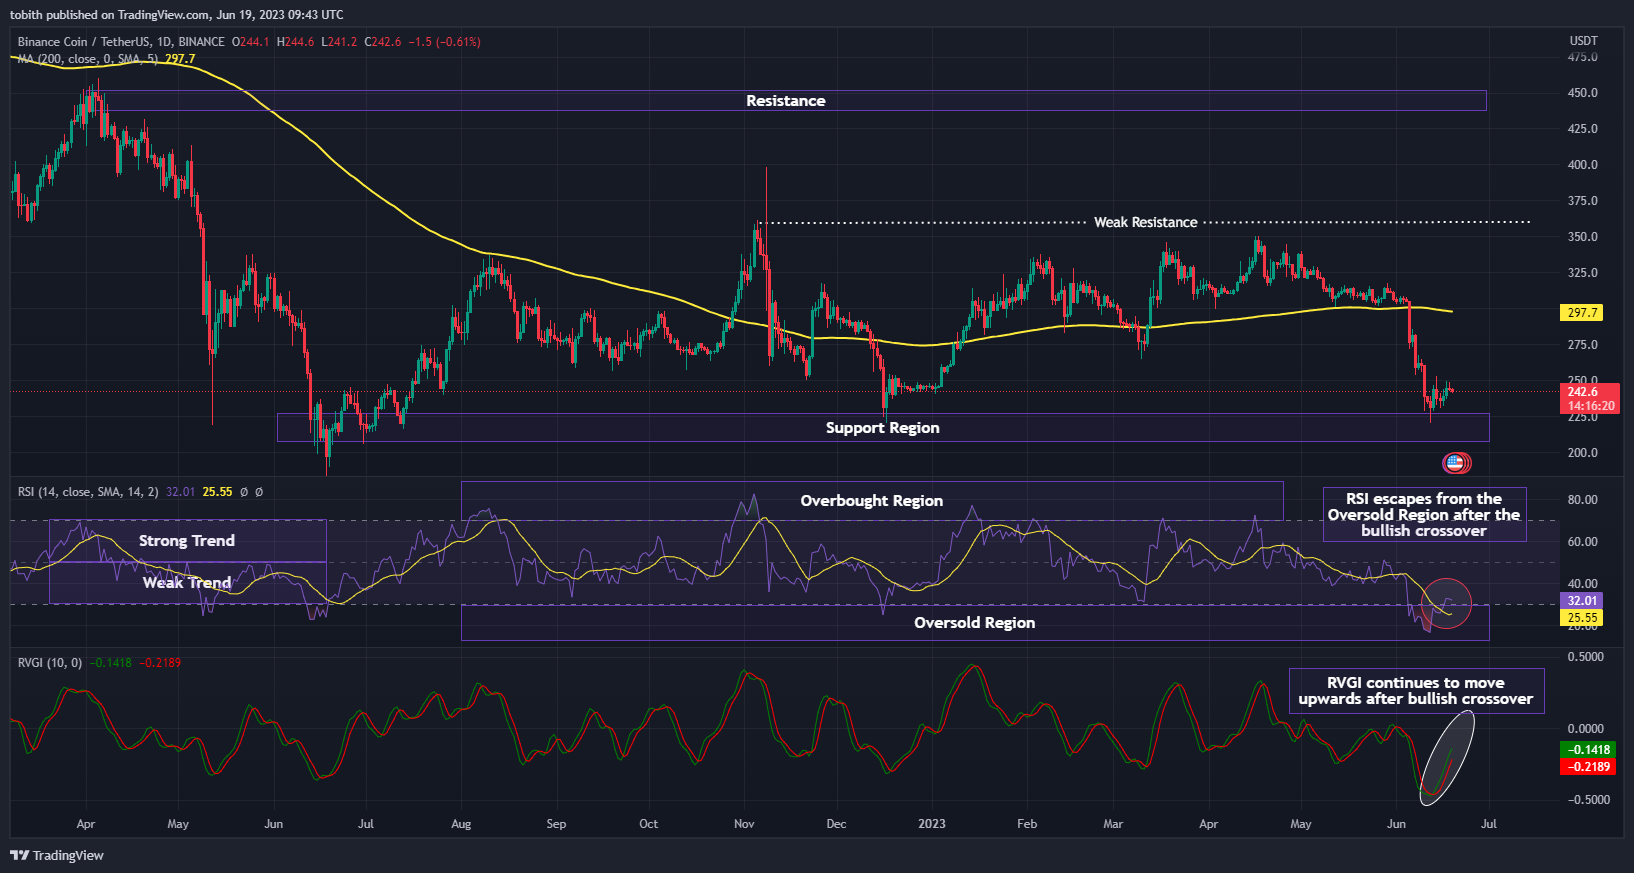
Upon further examination, the RSI and the RVGI indicators confirm that BNB may experience an uptrend over this week. For instance, RSI was valued at less than 30 and resided in the oversold vicinity, however, a bullish crossover was observed. However, the RSI formed a bullish crossover and escaped from the perils of the oversold region.
The RVGI also formed a bullish crossover and continued moving upwards, which complemented RSI’s bullish signal. Moreover, the bullish run could make BNB cross beyond the 200MA. If the candlesticks cross beyond the 200MA, then, there could be a high possibility that BNB may reach the Resistance level.
Ultimately, indicators confirm that BNB could experience an uptrend over the week after facing a slight fall earlier.
Disclaimer: The views and opinions, as well as all the information shared in this price analysis, are published in good faith. Readers must do their own research and due diligence. Any action taken by the reader is strictly at their own risk, Coin Edition and its affiliates will not be held liable for any direct or indirect damage or loss.
Disclaimer: The information presented in this article is for informational and educational purposes only. The article does not constitute financial advice or advice of any kind. Coin Edition is not responsible for any losses incurred as a result of the utilization of content, products, or services mentioned. Readers are advised to exercise caution before taking any action related to the company.
 Price Prediction 2026-2030: Will TRX Hit $0.50 Soon?")
 Price Prediction 2026-2050: Will HYPE Hit $100 Soon?")


: What Happens If You Use an Unlicensed Platform?")