


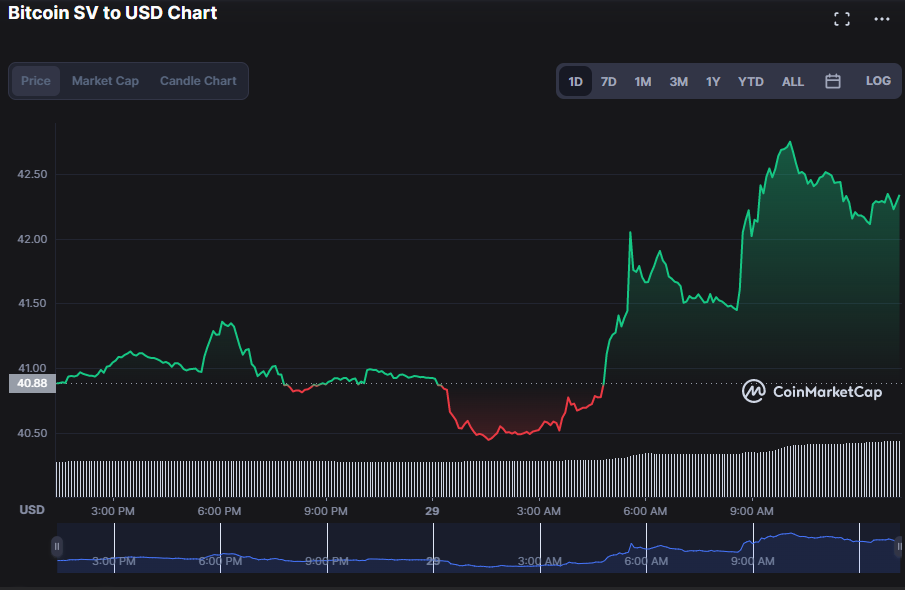
- On the previous trading day, $40.44 acted as support for BSV, while $42.76 acted as resistance.
- During the last day, the value of BSV increased by more than 3.55%.
- Strong optimistic market sentiment is reflected in the BSV price analysis.
At the opening of the market, Bitcoin SV (BSV) was valued at $40.88, with buyers in the driver’s seat. Although bulls maintained their day-to-day hegemony in the BSV market, they did have to recover from a series of brief periods of bear dominance that saw prices tumbling to an intraday low of $40.44.
This surge was underpinned by a rise in market capitalization and 24-hour trading volume of 3.90% to $818,169,237 and 64.60% to $46,352,199, respectively.
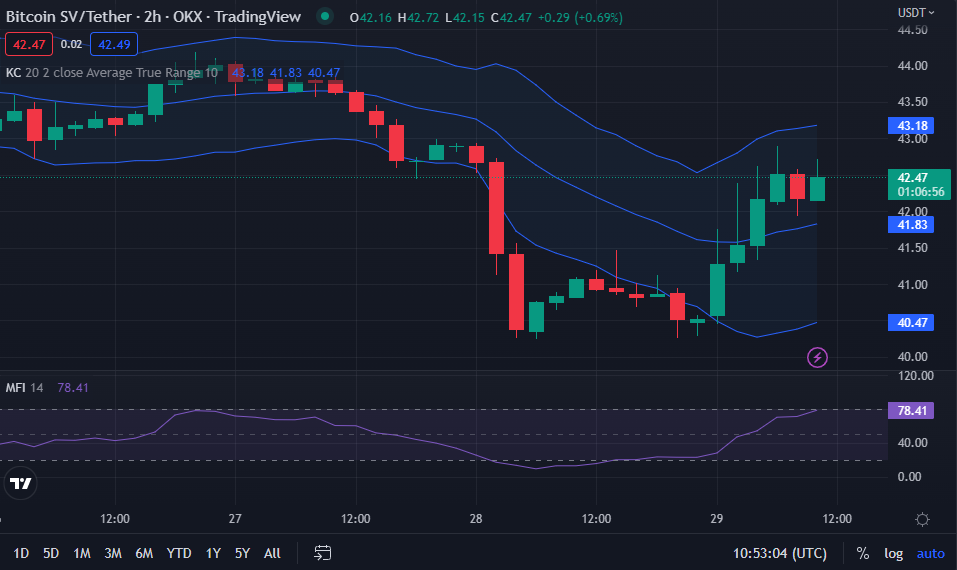
When the Money Flow Index (MFI) is greater than 50, the bulls win, and when it is less than 50, the bears win. MFI values greater than 80 are considered overbought, while levels less than 20 are considered undersold. As a result, signaling that the positive trend in BSV has yet to reach its peak, the MFI on its price chart reads 78.26 and points upward, implying that the bullish run may endure.
The Keltner Channel bands are broadening, supporting the premise that the upward trend will continue in the short run, with the top band at 43.18 and the lower band at 40.48. This movement indicates that market volatility is increasing, and a bullish candlestick is forming as the price oscillates above the signal line. These indicators show that bull vigor is increasing, raising the prospect of another bull run.
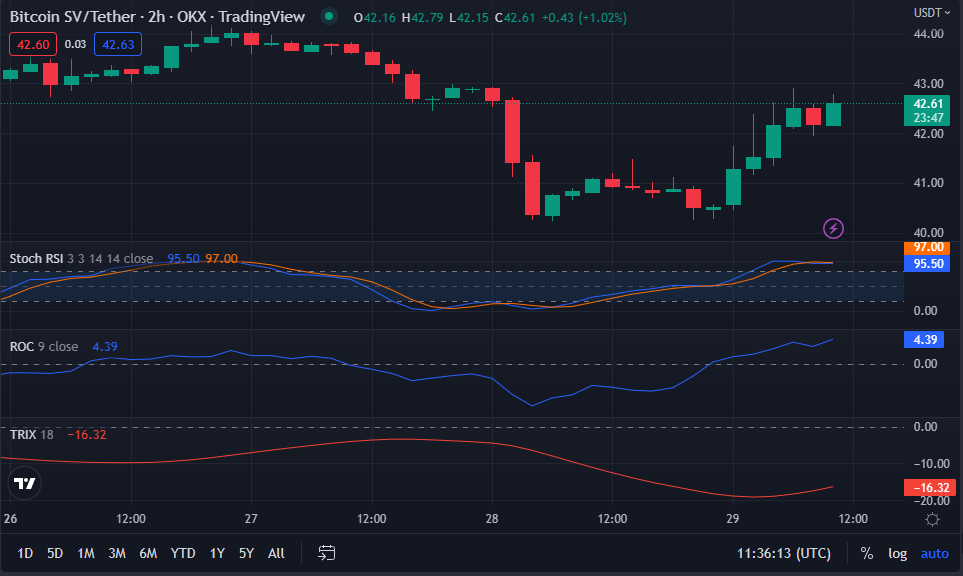
With a stochastic RSI reading of 93.61 and a move below the signal line, traders are warned that a reversal in the BSV market is possible if bulls’ hold weakens. This, however, merely acts as a warning to traders to exercise prudence in the immediate future.
This bullish trend is expected to continue for the foreseeable future as the indicator is at 4.07 and trending higher. The BSV market’s optimistic outlook is further bolstered by the rate of change moving into positive territory.
Momentum is said to be building when the value is positive and declining when it is negative. It is widely held that a purchase signal is generated whenever the TRIX closes above the zero line and a sell signal is generated once it closes below the zero line. As a result, buying pressure is fading in the BSV market, with the current reading being -16.32 points below the impartial zero line.
Ultimately, the bears seem fatigued, as technical indicators are rising north, suggesting that the bullish trend may continue.
Disclaimer: The views and opinions, as well as all the information shared in this price prediction, are published in good faith. Readers must do their research and due diligence. Any action taken by the reader is strictly at their own risk. Coin Edition and its affiliates will not be held liable for any direct or indirect damage or loss.
Disclaimer: The information presented in this article is for informational and educational purposes only. The article does not constitute financial advice or advice of any kind. Coin Edition is not responsible for any losses incurred as a result of the utilization of content, products, or services mentioned. Readers are advised to exercise caution before taking any action related to the company.


 Price Prediction 2026, 2027, 2028, 2029, 2030-2050")

