


- Dan Gambardello revealed in an X post today that another market crash may occur soon.
- According to the analyst, the potential market crash will then be followed by BTC printing higher highs.
- BTC’s price was able to overcome a medium-term negative trend line and was challenging resistance at press time.
The cryptocurrency trader and analyst Dan Gambardello shared in an X post earlier today that the cryptocurrency market crashing one more time “would make sense as far as cycles go.” Following this potential crash, the analyst anticipates that Bitcoin (BTC) may print higher highs to lead the market into the next bull run.
Meanwhile, CoinMarketCap indicated that the global cryptocurrency market cap rose 0.18% over the past 24 hours. Subsequently, the market’s combined valuation stood at around $1.08 trillion at press time. BTC, however, recorded a slight 24-hour loss of 0.09% and was trading at $26,938.44 as a result.
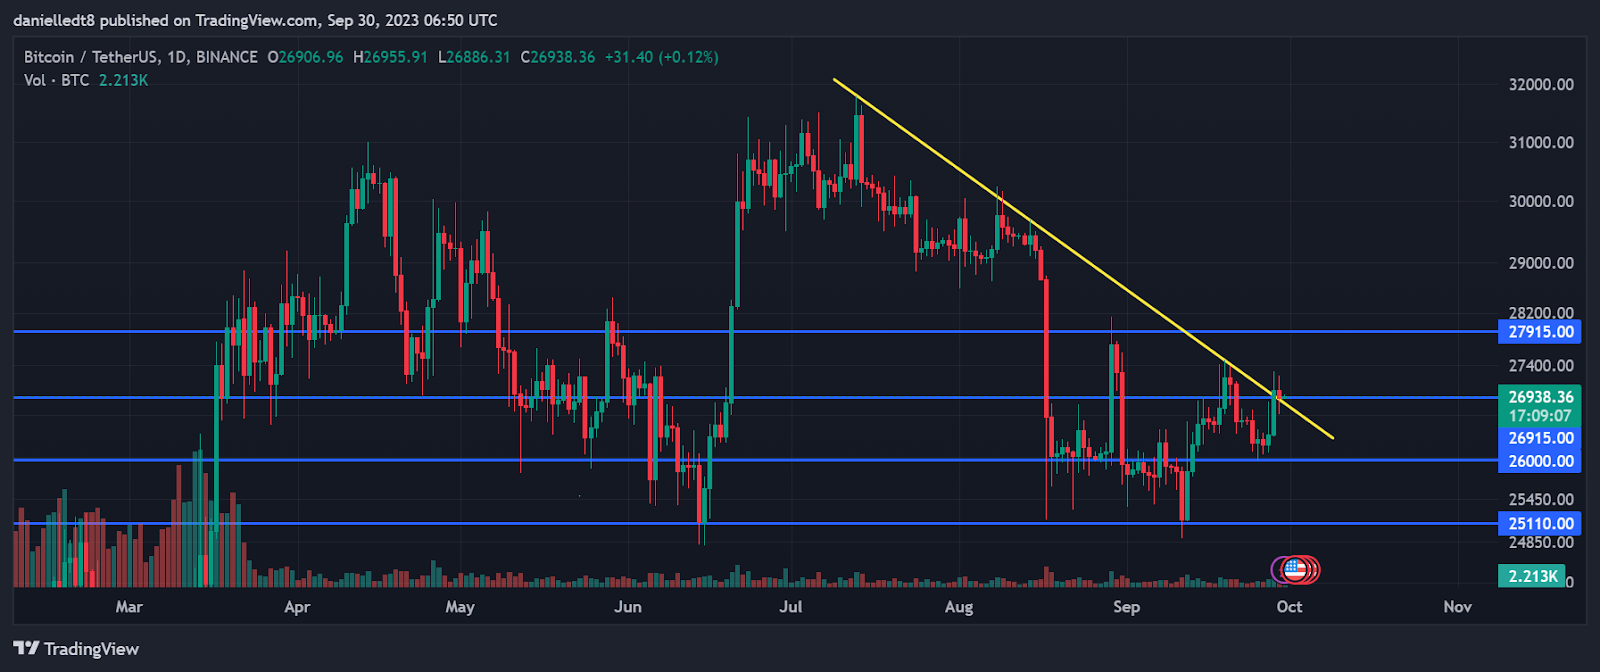
From a technical perspective, BTC’s price was able to break out of a medium-term bearish trend during the past few days. Shortly after escaping the bearish trend, the market leader’s price encountered the key resistance level at $26,915. If BTC is able to close a daily candle above this threshold within the next 48 hours, then it may enter into a bullish move towards the $27,915 mark.
Conversely, failure to close a daily candle above the $26,915 resistance level could lead to a sharp pull back in BTC’s price. In this bearish scenario, the cryptocurrency may see its value drop to as low as $26K in the following week. Continued sell pressure may also force BTC’s price down to $25,110.
However, a noteworthy bullish technical flag was triggered on BTC’s daily chart recently which suggested that a bullish scenario may be more likely to play out in the next 24-48 hours. Throughout the past 2 days, the 9-day EMA line crossed above the 20-day EMA line.
This particular technical flag suggests that short-term momentum may have shifted in favor of buyers – giving them a slight upper hand against bears. Subsequently, the leading cryptocurrency’s price may soon flip the $26,915 resistance level into support soon, if this technical flag is validated and bulls continue to support BTC’s price in the short term.
Disclaimer: The views and opinions, as well as all the information shared in this price analysis, are published in good faith. Readers must do their own research and due diligence. Any action taken by the reader is strictly at their own risk. Coin Edition and its affiliates will not be held liable for any direct or indirect damage or loss.
Disclaimer: The information presented in this article is for informational and educational purposes only. The article does not constitute financial advice or advice of any kind. Coin Edition is not responsible for any losses incurred as a result of the utilization of content, products, or services mentioned. Readers are advised to exercise caution before taking any action related to the company.
 Price Prediction 2026, 2027, 2028, 2029, 2030-2050")


