


- Van de Poppe predicted that BTC could rally to as high as $48K in the next few weeks
- BTC’s price could undergo a strong correction after the first spot Bitcoin ETF gets approved, the analyst noted
- At press time, BTC was changing hands at $37,478.55 after a slight 0.04% 24-hour loss
Michael Van de Poppe, a widely-followed analyst, predicted that Bitcoin (BTC) may rise to as high as $48K in the weeks leading up to the first spot Bitcoin exchange-traded fund (ETF) getting approved. Following the approval, the analyst anticipates a strong price correction before a “grind” upwards.
In the video, Van de Poppe shared that he thinks the first spot Bitcoin ETF will receive approval in the next five to six weeks. Furthermore, he predicted that BTC may rally in December as investors try to position themselves to profit from the potential ETF approval.
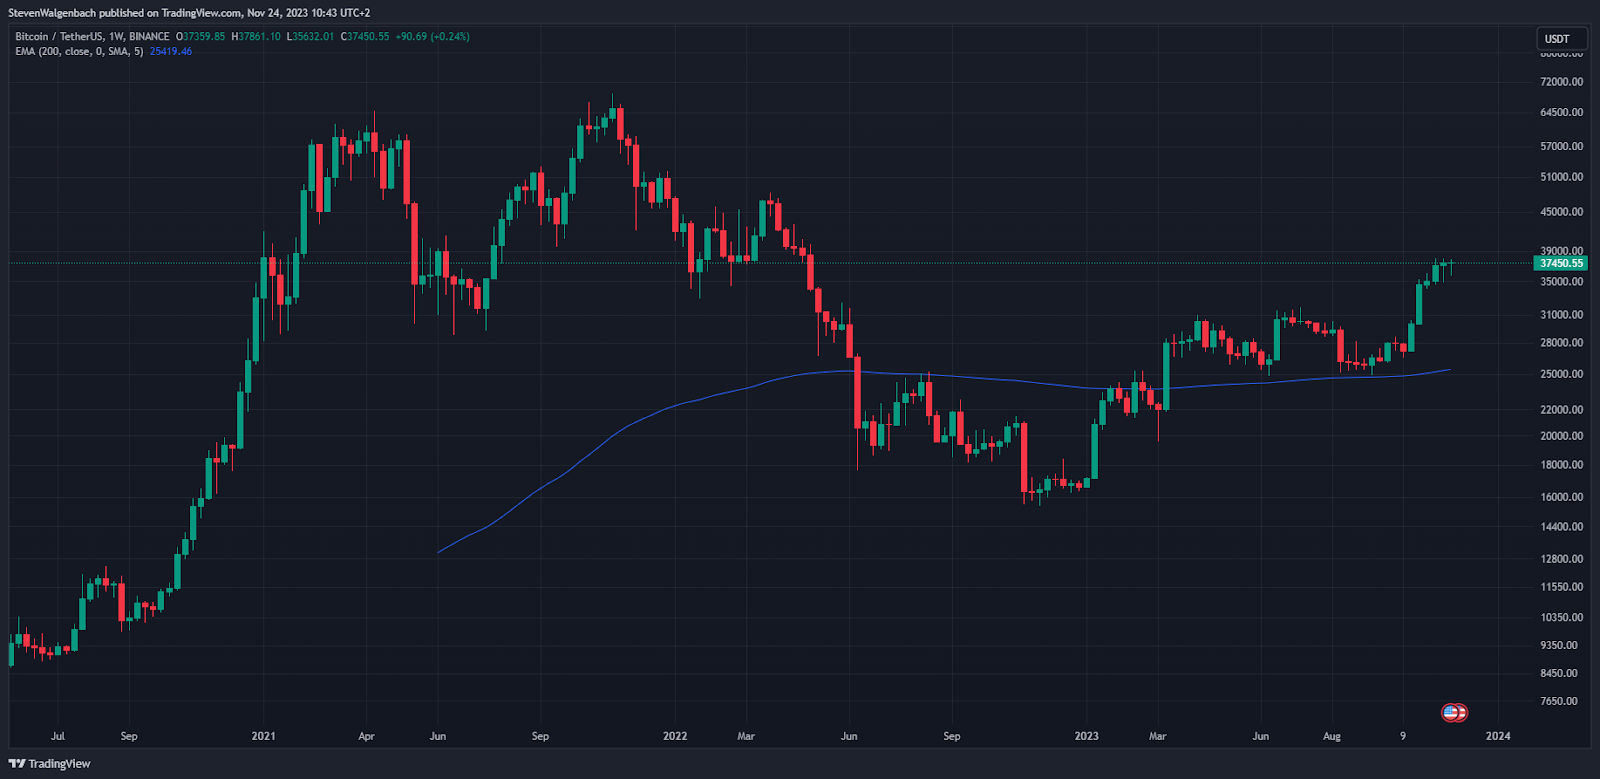
Following the first Spot Bitcoin ETF getting approved, the analyst believes that the leading cryptocurrency’s price may fall. His downside target for this potential pullback is the 200-week Exponential Moving Average (EMA) line on BTC’s chart, which was situated at around $25.4K. This downtrend may continue after the upcoming halving event, noted Van de Poppe.
He believes that traders will then start accumulating BTC, which will ignite the next bull run. In this bullish scenario, he set his upside target for BTC’s price at between $300K and $400K.
At press time, BTC was changing hands at $37,478.55, according to CoinMarketCap data. This was after the largest cryptocurrency in terms of market cap slipped 0.04% over the past 24 hours. Despite this slight correction, BTC’s price was still up 2.99% in the weekly timeframe.
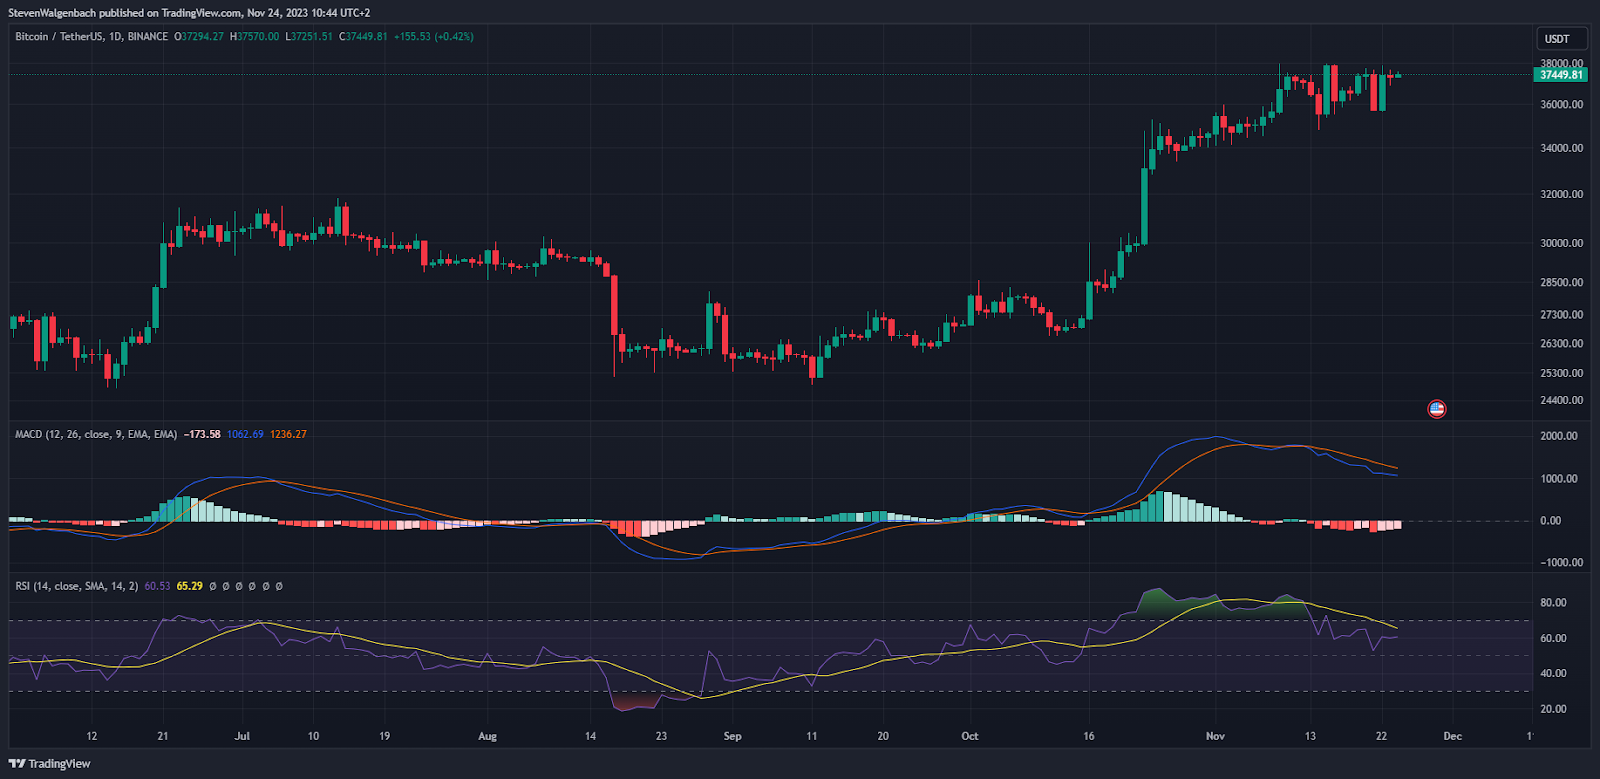
From a shorter-term technical perspective, two significant bullish technical flags were on the verge of being triggered on BTC’s daily chart. Both the Moving Average Convergence Divergence (MACD) and Relative Strength Index (RSI) indicators suggested an incoming bullish shift in BTC’s momentum.
The RSI line was closing in on the RSI Simple Moving Average (SMA) line. Traders normally identify this as a sign of growing buyer strength. Furthermore, the MACD line was approaching the MACD Signal line, which may indicate that BTC’s trend will undergo a bullish reversal.
Disclaimer: The information presented in this article is for informational and educational purposes only. The article does not constitute financial advice or advice of any kind. Coin Edition is not responsible for any losses incurred as a result of the utilization of content, products, or services mentioned. Readers are advised to exercise caution before taking any action related to the company.
 Price Prediction 2026, 2027, 2028, 2029, 2030 -2050")


