


- Santiment announced that the prices of crypto and equities have declined.
- BTC is currently struggling to stay afloat above the 200 EMA.
- RSI, BBP, and CMF could show signs of the bear season for BTC.
Analyzing the current market, Santiment, a market intelligence platform, took to Twitter to announce that the prices of crypto and equities have declined together after witnessing a bull run at the start of 2023. Santiment also pointed out that Bitcoin and altcoins have corrected a bit.
The 4-hour trading chart shows that BTC witnessed a sudden vertical jump just a few days after the golden cross was made during the intersection of 50 EMA and 200 EMA. During BTC’s bull run, the price kept on going upward.
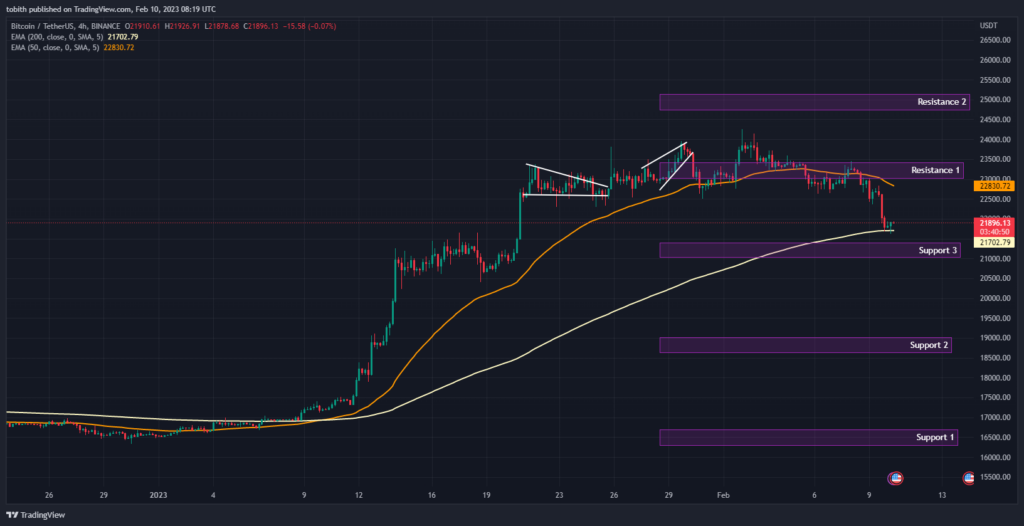
Around the last week of January, BTC started off with a descending triangle pattern, before making its entry to the top. Then, in the final days of January, BTC formed a rising wedge pattern leading the price to break the Resistance 1 region, which is above $23,000 level.
However, after the formation of the rising wedge, BTC started experiencing tremors which made it have an unpredictable price movement. On Sunday, BTC began witnessing a downtrend, which made it go below the 50 EMA. BTC is currently struggling to stay afloat on the 200 EMA line, if the price breaks below it, this would give an indication that BTC might fall under the bear trap.
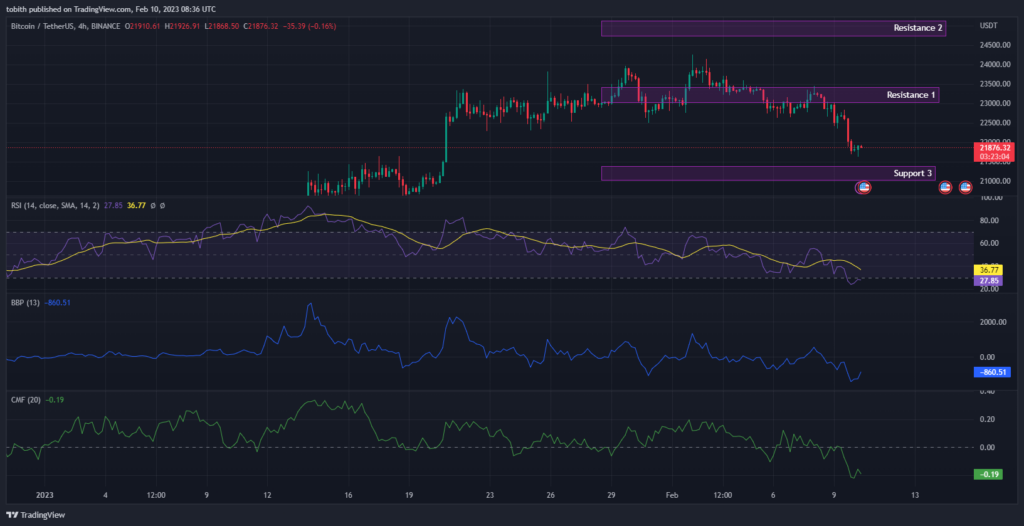
The Relative Strength Index (RSI) is valued at 27.85, which is the oversold region. The RSI shows that this could be the perfect time for traders to start buying. Moreover, the RSI is less than the SMA, which could indicate that BTC could fall into the bear trap.
Moreover, The Chaikin Money Flow (CMF) is valued at negative 0.19, which is below the zero signal. As the price is currently struggling to say afloat on the 200 EMA and CMF in the negative zone, this could confirm that BTC may fall right into the grasp of bears.
With the Bull Bear Power being valued at negative 860.51, the power remains in the claws of the bears. BBP in the negative zone also could confirm that BTC may fall and witness a bear season. If the price continues to fall down, it may reach the Support 3 region and remain there for some time; however, for some reason, if there is an unexpected turn of events, BTC will go upwards and regain its place in the Resistance 1 region at above $23,000.
Disclaimer: The views and opinions, as well as all the information shared in this price analysis, are published in good faith. Readers must do their own research and due diligence. Any action taken by the reader is strictly at their own risk, Coin Edition and its affiliates will not be held liable for any direct or indirect damage or loss.
Disclaimer: The information presented in this article is for informational and educational purposes only. The article does not constitute financial advice or advice of any kind. Coin Edition is not responsible for any losses incurred as a result of the utilization of content, products, or services mentioned. Readers are advised to exercise caution before taking any action related to the company.
 Price Prediction: Can BTW Sustain Its Breakout Above $0.1032?")


