


- Bulls pull BTC out of red zone amid heaping pressure from the bears.
- BTC struggles to get going after the early November crash but recovers well in late December.
- The RSI is at 81.18, well over the overbought region; the bulls could negate this sentiment.
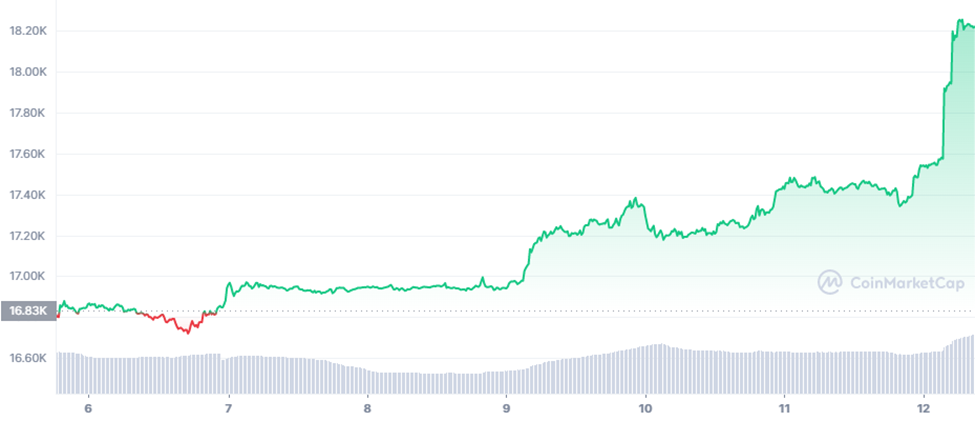
Bitcoin (BTC) opened the market for the week, trading at $16,802. It took a head start trading in the green zone for the first day, as shown in the chart below. However, towards the latter part of the first day, BTC tanked into the red zone and reached its lowest price of $16,720 for the week.
But before long, the bulls came to BTC’s rescue and helped the coin step out of the red zone. Following this, BTC traded in the green zone. Although the bulls were able to pull BTC out of the red zone, the bears did not allow BTC to hit $17,000 for the first three days.
However, in the early hours of the fourth day, the bulls gave BTC momentum to break the $17,000 mark. After BTC broke $17,000, it has been fluctuating in the $17,000-$17,500 range. But today, the bulls gave BTC support, and its price rose from $17,358 yesterday to $18,152 as of press time.
When considering the chart below, BTC has been struggling to get going after its crash in early November 2022. BTC made lower highs and thereafter started consolidating. In mid-December, BTC crossed the $18,000 mark.
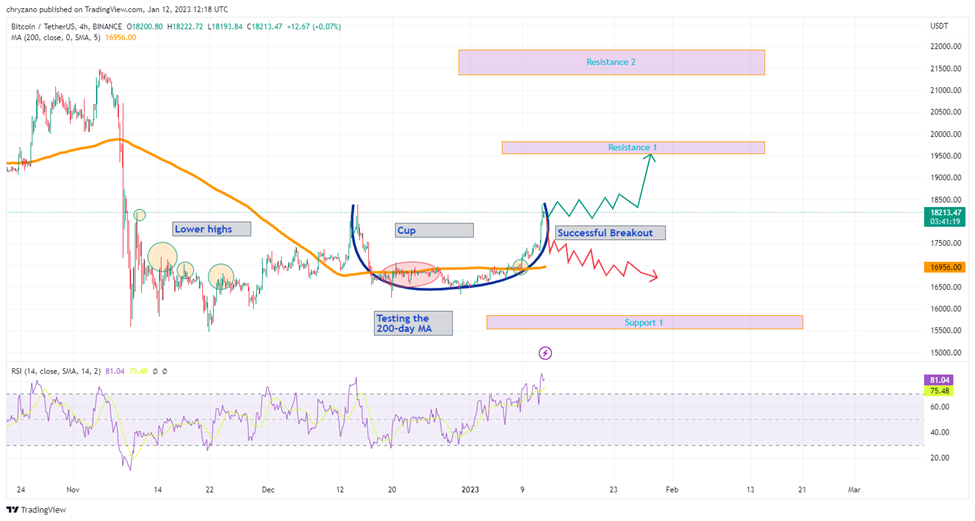
When considering BTC price fluctuation from mid-December to date, it has been forming the cup pattern. In late December, BTC tested the 200-day MA but failed to break it. However, during the second week of January, BTC broke the 200-day MA and reached the $18,000 mark.
Interestingly, the 200-day MA line is parallel to the horizontal line, and if the bears bring the prices down, BTC could fall below the 200-day MA. However, since the territory near the 200-day MA has been a stronghold, we could expect BTC to test the 200-day MA on and off.
Contrastingly, if the bulls build up the pressure, BTC could reach resistance 1, which is close to $20,000. However, the RSI is at 81.18, well over the overbought region of 70. As such, the market could correct the prices, and BTC could tank lower.
Disclaimer: The views and opinions, as well as all the information shared in this price analysis, are published in good faith. Readers must do their own research and due diligence. Any action taken by the reader is strictly at their own risk, Coin Edition and its affiliates will not be held liable for any direct or indirect damage or loss.
Disclaimer: The information presented in this article is for informational and educational purposes only. The article does not constitute financial advice or advice of any kind. Coin Edition is not responsible for any losses incurred as a result of the utilization of content, products, or services mentioned. Readers are advised to exercise caution before taking any action related to the company.


