


- CrediBULL Crypto suspects that BTC’s latest price drop appears to be a deliberate effort to manipulate the market.
- The analyst predicts that BTC’s price may rise again soon to as high as $27K.
- Two significant bearish flags were on the verge of being triggered on BTC’s daily chart.
The recent downward movement in Bitcoin (BTC) price appears to be a deliberate effort to manipulate the market in a negative direction, according to a post shared by the cryptocurrency analyst CrediBULL Crypto. This came after a noticeable and verified accumulation phase took place over the past few days.
Data from the market intelligence platform, Santiment, indicated that MicroStrategy was one institutional investor that decided to take advantage of the buying opportunity to stock up on BTC. According to an X post shared by Santiment yesterday, MicroStrategy acquired about 5,445 BTC, worth more than $147.3 million.
This was MicroStrategy’s largest accumulation since 5 April of this year, where they bought BTC tokens 6 days before the cryptocurrency king’s price rose to $30K. CrediBULL Crypto predicted that he believes, in the current situation, BTC’s price could soon spike to $27K.
Over the last 24 hours of trading, BTC’s price managed to increase by 0.64%, according to CoinMarketCap. This brought the value of the leading cryptocurrency to approximately $26,292.14 at press time. Furthermore, BTC’s 24-hour trading volume experienced a slight uptick of 0.28%, reaching a total of $10,478,630,893.
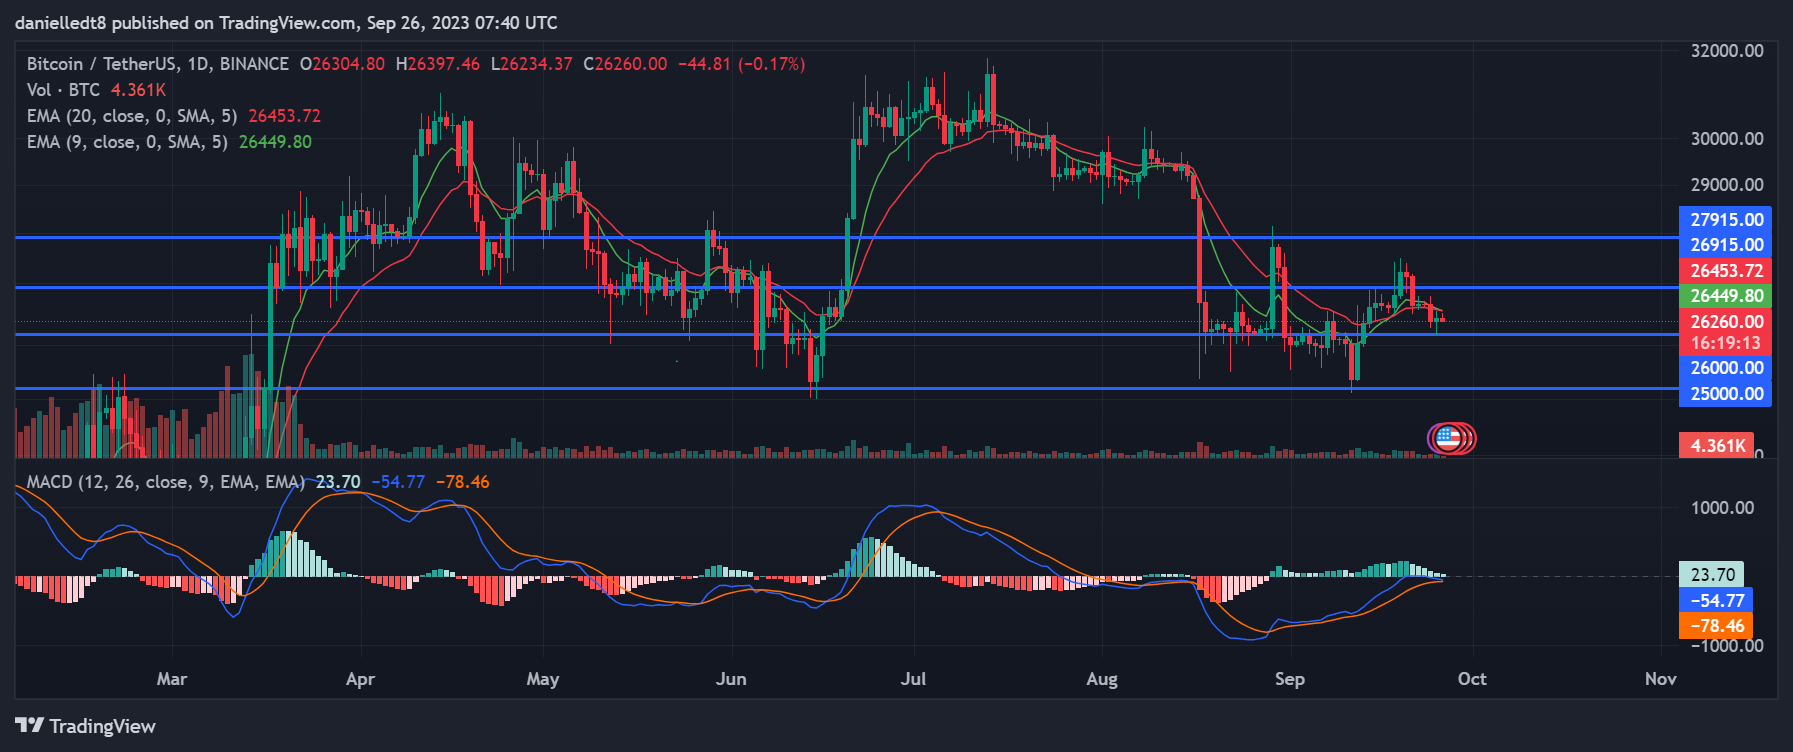
From a technical standpoint, 2 significant bearish flags were on the verge of being triggered on BTC’s daily chart. Firstly, the 9-day EMA line was attempting to cross below the 20-day EMA line at press time. This suggested that there had been more sell volume on BTC’s charts over the past 9 days than there was in the previous 20 days.
In addition to this, the daily MACD line was on the cusp of crossing below the daily MACD Signal line as well. If these technical indicators cross, it may be an indication of BTC’s latest bearish trend continuing in the next few days.
If both of these technical flags are triggered and validated, BTC’s price may break below the critical $26K support level. Thereafter, traders may continue to drag BTC down to the $25K mark as well.
On the other hand, BTC closing a daily candle above the 9-day EMA line at around $26,449.58 within the next 48 hours may invalidate the bearish thesis. This may then lead to BTC breaking above $26,915 before potentially rising to the next threshold at $27,915.
Disclaimer: The views and opinions, as well as all the information shared in this price analysis, are published in good faith. Readers must do their own research and due diligence. Any action taken by the reader is strictly at their own risk. Coin Edition and its affiliates will not be held liable for any direct or indirect damage or loss.
Disclaimer: The information presented in this article is for informational and educational purposes only. The article does not constitute financial advice or advice of any kind. Coin Edition is not responsible for any losses incurred as a result of the utilization of content, products, or services mentioned. Readers are advised to exercise caution before taking any action related to the company.
 Price Prediction 2026-2030: Will TRX Hit $0.50 Soon?")
 Price Prediction 2026-2050: Will HYPE Hit $100 Soon?")


: What Happens If You Use an Unlicensed Platform?")