


- Profit Blue tweeted that BTC could rise to 17.5K and fall to 10K forming double tops.
- BTC started in the green area last Monday but is currently trading in the red area.
- Higher-high registered by BTC has been followed by sideways movement in the regression trend.
Twitter crypto advisor @profit8lue, tweeted that there was a high chance of Bitcoin coming back to $17,500-$17,700 and then tanking hard to 10k, forming a double top in quick succession.
Additionally, Profit Blue predicted that this move of BTC would manipulate many traders.
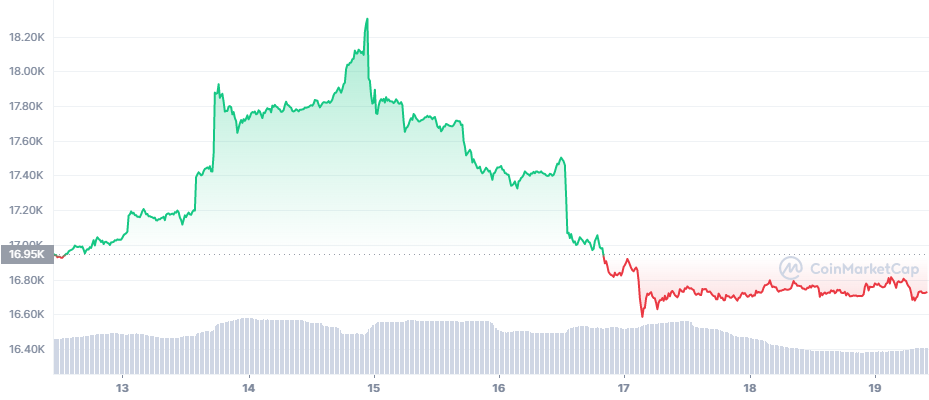
Although BTC started at $16,941 (red zone) last Monday, December 12, it was able to enter the green area shortly, as shown in the chart below. BTC reached new heights trading in the green zone and reached a maximum of $18,303 on December 14. Shortly after hitting its maximum, BTC started its descent in the green area.
But before long, BTC entered the red zone tanking even further. Since BTC entered the red zone on December 16, it has been trading in the red area, moving sideways. As of press time, BTC is down 0.12% in the last 24 hours and trading at $16,741, according to CoinMarketCap.
As shown in the chart below, the regression trend channel indicates that BTC has been trading in a bullish flag, since November 21. It has been setting higher lows from late November to mid-December. While within the regression channel, BTC tested Resistance 1 ( $18,250) once; however, it wasn’t able to retain its position and came tumbling down.
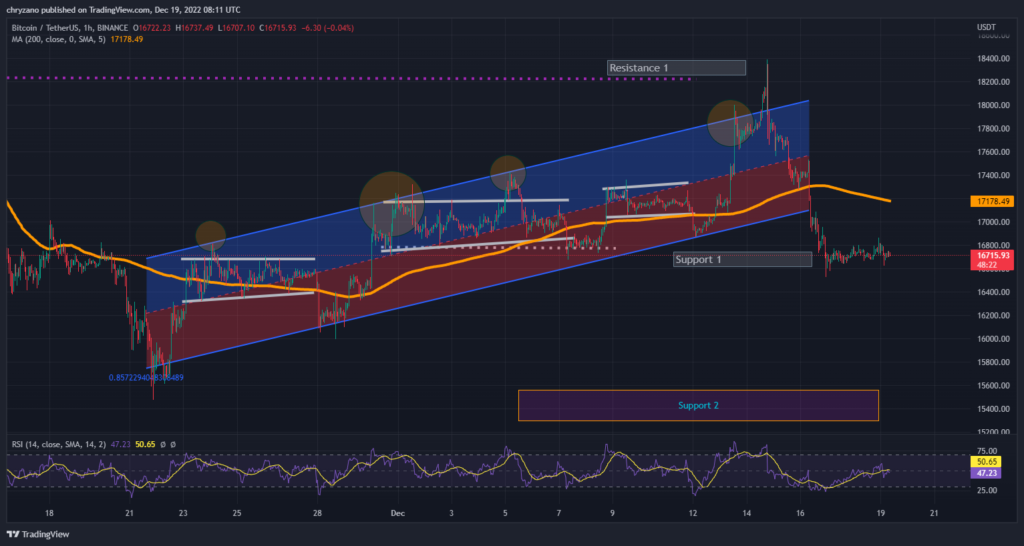
Notably, even when BTC was trading within the regression channel, its price was moving sideways after recording higher highs (yellow circles). However, now that the trend is broken, BTC is moving sideways with short-range vertical movements. This sentiment is upheld by the Bollinger bands as they are constricting the price.
With the RSI index at 48.93, the trend is well, and we could expect more sideways movement. However, if the bulls are dominant, BTC may break through the 200-day MA, its immediate resistance, and aim at Resistance.
Contrastingly, if the bears take over BTC, which is in the support 1 region, may tank to support 2, positioned at $15,570.
Disclaimer: The views and opinions, as well as all the information shared in this price analysis, are published in good faith. Readers must do their own research and due diligence. Any action taken by the reader is strictly at their own risk, Coin Edition and its affiliates will not be held liable for any direct or indirect damage or loss.
Disclaimer: The information presented in this article is for informational and educational purposes only. The article does not constitute financial advice or advice of any kind. Coin Edition is not responsible for any losses incurred as a result of the utilization of content, products, or services mentioned. Readers are advised to exercise caution before taking any action related to the company.
 Price Prediction: Can BTW Sustain Its Breakout Above $0.1032?")


