


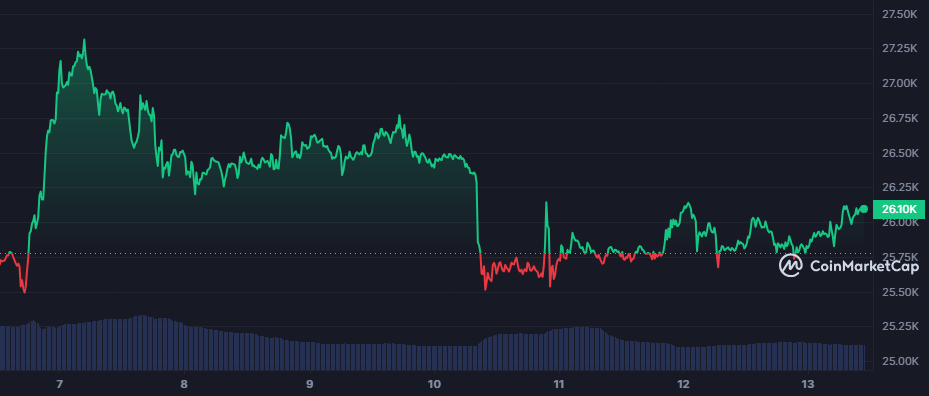
- Rekt Capital tweeted that BTC closed below the $26,200 level, unable to reclaim the $27,600 as support.
- BTC is currently priced at $26,082.69 after witnessing a spike of 0.95% in 24 hours.
- Indicators highlight that BTC could experience an uptrend in the future.
Analyzing BTC’s performance over the week, a crypto analyst under the pseudonym of ‘Rekt Capital’ tweeted that Bitcoin closed below the $26,200 level, unable to reclaim the $27,600 as support. Moreover, the crypto analyst mentioned that the ‘blue level’ ($26,638.3) could become the new resistance for BTC in the future.
Currently, BTC experienced a 1.19% surge in seven days which led it into the green zone. BTC is priced at $26,082.69 after witnessing a spike of 0.95% in 24 hours, based on CoinMarketCap. Even though BTC fell below the $26,200 level, the cryptocurrency leader still has a trading volume of $11,583,591,020, at the time of writing.
Looking at the 1-day chart of BTC/USD, the candlesticks are currently in the lower half of the Bollinger Bands, which could be considered that there is a downtrend in the market. Moreover, the gap between the upper band and the lower band remains narrow, indicating that market volatility is low for BTC. Since BTC failed to trade above the $26K support level, $25,000 could be considered as the support level.
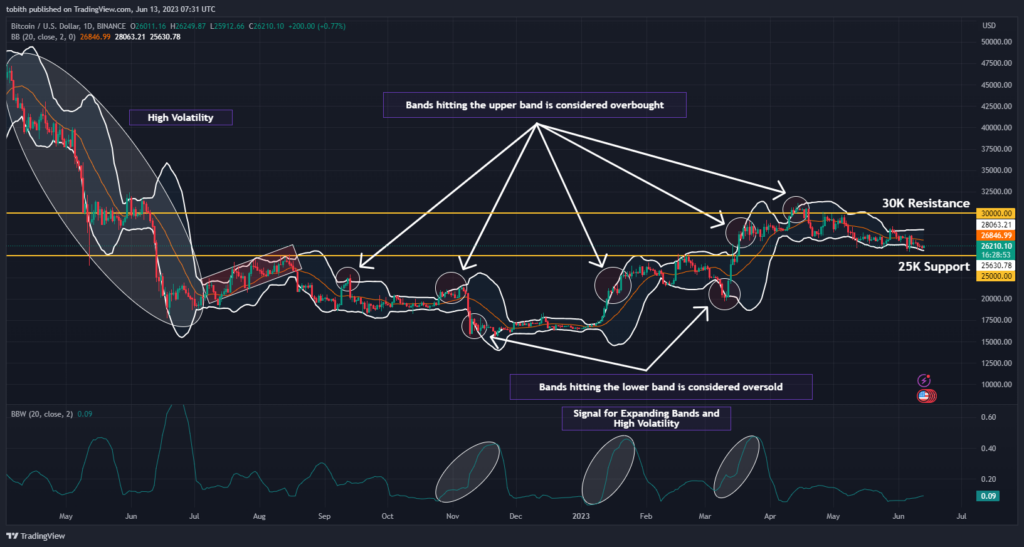
BTC’s volatility could remain low for some time as the Bollinger Band Width (BBW) is moving horizontally compared to its previous behavior. Furthermore, BTC’s candlesticks retraced back inside the Bollinger Band after it was driven to the oversold region. However, BTC’s retracement missed the opportunity to reach the top half of the Bollinger Bands.
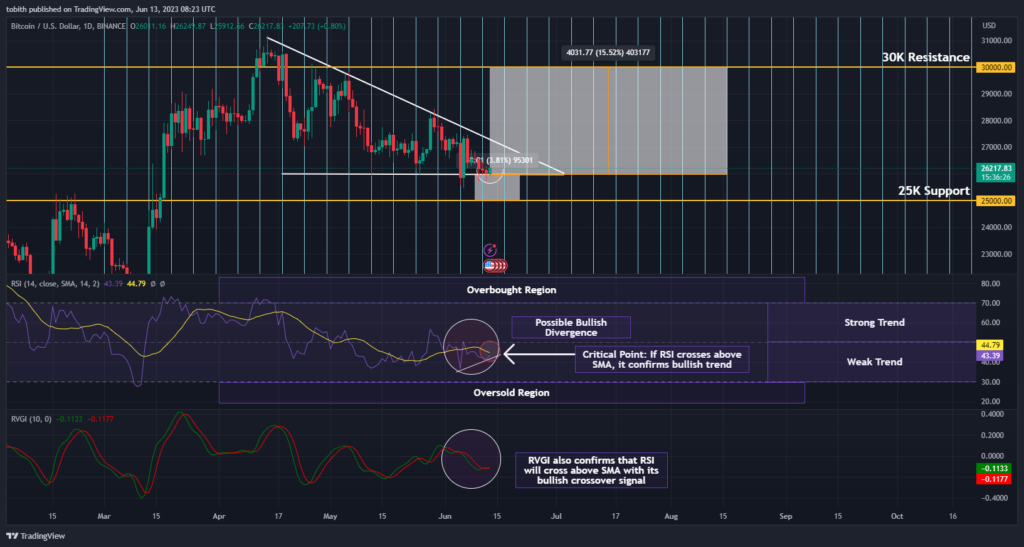
BTC’s current price momentum is forming a descending triangle pattern as new higher lows seem to form. The descending triangle could create two entry points: bullish and bearish. During the bearish entry point, BTC could fall by 3.81% to touch the Support level.
Meanwhile, the BTC needs to rise by 15.52% in order to make $30K in the new Support level. If BTC experiences a similar trend strength during its gradual downtrend, then, the crypto leader could reach $30K over 11 weeks.
Furthermore, the RSI is valued at 43.70 and remains below the SMA, which is considered a bearish signal. However, the RSI may cross above the SMA as the gap between them is quite narrow. This crossover would confirm the start of BTC’s uptrend. After the bullish crossover, RSI could reside within the strong trend vicinity for some time, driving the price upwards toward BTC’s $30K goal.
The RVGI’s bullish crossover also confirms that the RSI would cross above the SMA. Another possible signal regarding BTC’s uptrend would be through the formation of a medium bullish divergence observed in the RSI. If the RSI forms higher lows, then, BTC could continue to rise up avoiding the $26K level.
Disclaimer: The views and opinions, as well as all the information shared in this price analysis, are published in good faith. Readers must do their own research and due diligence. Any action taken by the reader is strictly at their own risk, Coin Edition and its affiliates will not be held liable for any direct or indirect damage or loss.
Disclaimer: The information presented in this article is for informational and educational purposes only. The article does not constitute financial advice or advice of any kind. Coin Edition is not responsible for any losses incurred as a result of the utilization of content, products, or services mentioned. Readers are advised to exercise caution before taking any action related to the company.


