


- Co-Founder of Mechanism Capital tweets, BTC spiked 2.7 times during echo bubble pullback in 2019.
- BTC flounders in the red zone early in the week before bulls skyrocket BTC to $23,243.
- Bulls give out with testing the second top of the M-pattern due to sheer exhaustion.
Co-Founder of Mechanism Capital Andrew Kang tweeted that Bitcoin (BTC) went through a similar pullback in 2019’s echo bubble before its spiked 2.7 times its price. Moreover, he stated that parameters like momentum, price action/timing, market structure, positioning, and sentiment had little effect on this hike.
Meanwhile, during the past week BTC was trading in the red zone for the first two days of the week, as shown below. BTC was priced at 21.29K when the markets opened for trading. Just after the markets opened, the currency tanked to the red zone and reached its lowest price of $20,611 on the first day of the week itself.
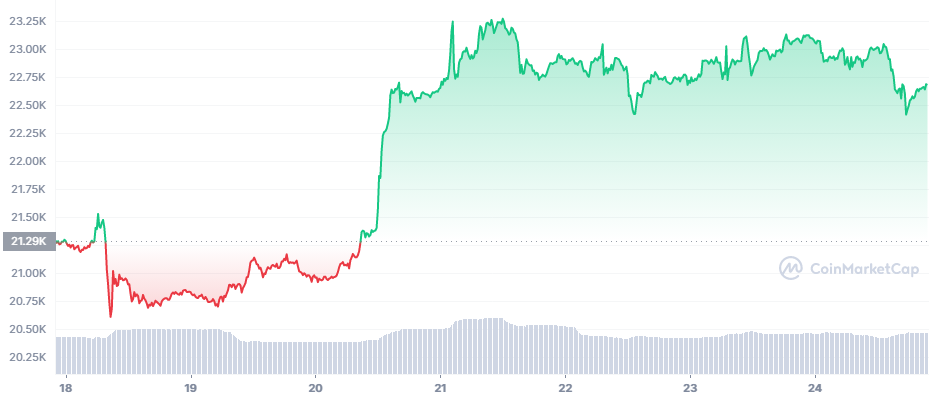
However, during the early hours of the third day, the bulls came to BTC’s rescue and pulled it out of the red zone. The bulls helped BTC reach its maximum price of $23,243 during the last hours of the third day. Since the coin reached the green zone it has been trading in the $22.5-23.25K range during the latter part of the week.
As Kang mentioned, this may be the pullback that BTC is going through just after the 2019 echo bubble. However, BTC is up 1.90% in the last 24 hours and is priced at $22,683, at press time.
As shown in the chart below, BTC fluctuated taking the form of letter W, Double bottom (Denoted in Orange) when it was consolidating. The formation of the W denotes a bullish reversal and this is reciprocated in BTC’s behavior as the currency rose from $21,478 to $22,740.
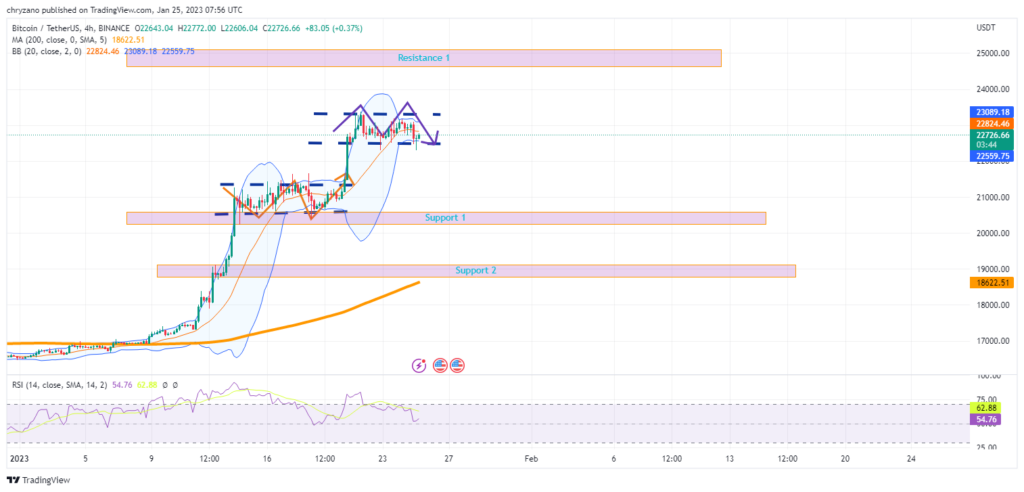
Currently, BTC is moving sideways and traversing an inverted W-pattern or M-pattern (Double Top). As such, a bearish reversal could be on the cards. When considering the double tops BTC formed, the second top is lower than the first. This denotes the resistance of the bears and the exhaustion of the bulls.
Meanwhile, those who held a long position after the formation of the W (bullish reversal) should consider whether they should still go long. However, having said that, this could be another position for BTC to consolidate before it surges again. Additionally, the Bollinger bands are contracting, and this seconds the consolidation of BTC.
But the question lies in whether there is yet another surge in BTC after consolidating. Will the bulls catapult the top coin to resistance 1 or higher? Or will the bears take over the market?
Disclaimer: The views and opinions, as well as all the information shared in this price analysis, are published in good faith. Readers must do their own research and due diligence. Any action taken by the reader is strictly at their own risk, Coin Edition and its affiliates will not be held liable for any direct or indirect damage or loss.
Disclaimer: The information presented in this article is for informational and educational purposes only. The article does not constitute financial advice or advice of any kind. Coin Edition is not responsible for any losses incurred as a result of the utilization of content, products, or services mentioned. Readers are advised to exercise caution before taking any action related to the company.


