


- Analyst KALEO says the bears are using BTC’s LTF pullback to try and convince others that the price will continue to fall.
- BTC is currently trading at $23,406.09, witnessing a fall of 0.12% in just one day.
- Indicators show that it is hard to examine BTC’s behavior at its current state.
Observing the trends of the market, crypto analyst KALEO took to Twitter to address that the bears are using BTC’s LTF (low-time frame) pullback to try and convince others that the price will continue to fall. The crypto analyst also advises the community that this movement is a simple breakout/retest before it continues to go upwards.
Bitcoin is currently trading at $23,406.09, witnessing a fall of 0.12% in just one day. Moreover, BTC also plummeted by 6.32% in just seven days, and for the time being, might reside within the red region. However, Some traders’ FOMO and FUD attitudes, observed by some analysts, could be one of the reasons why BTC currently stays in the red region.
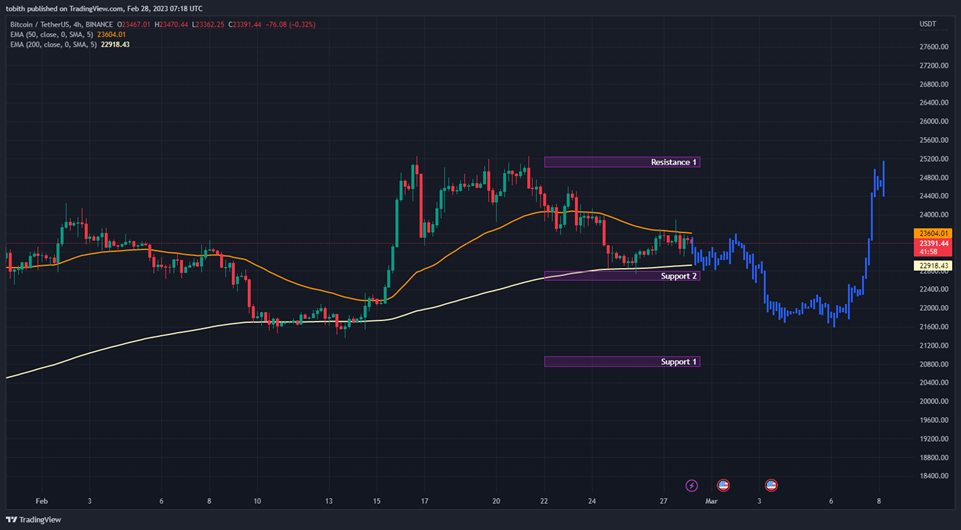
When looking at the four-hour chart, BTC is currently squeezed within the gaps of 50 EMA and 200 EMA giving signs of consolidation. The gap between both the indicators may look like its closing in, and, if it crosses and forms a death cross, it could be an indication that the bear season has started. If the bear season starts for BTC, the price could dive even deeper below Support 2, which is at $22K level.
However, there was a similar price movement observed at the start of this month. BTC, similarly, was moving at its current trajectory before it tumbled. Like a phoenix born out of the ashes, BTC rose and started to fly and made its nest within the Resistance 1 region, which is priced at $25K. There is a possibility that BTC could follow this same flight path.
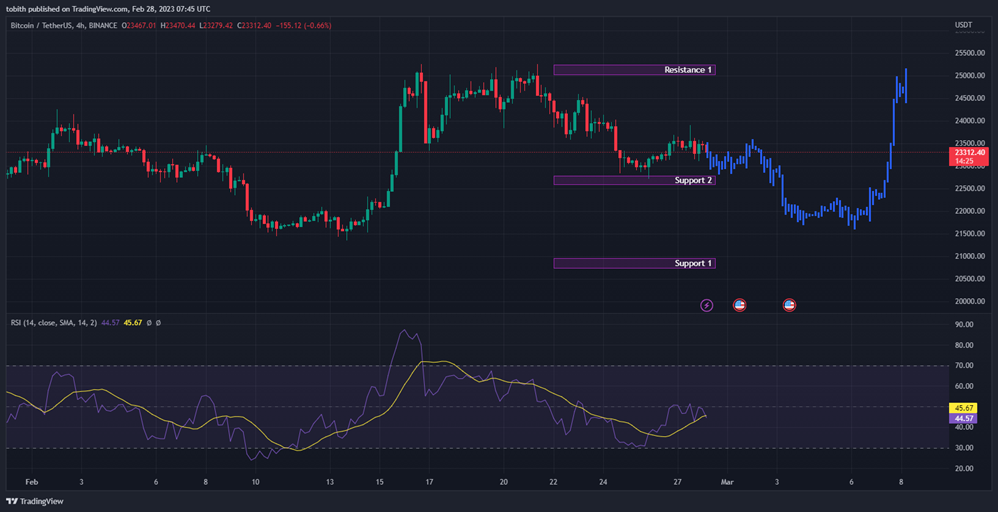
Furthermore, the RSI is valued at 44.57, which could be considered neutral territory. RSI’s movement shows that at the current rate, BTC may continue to sink, however, this could be a small market hiccup before it retests, later, at its current position.
Many crypto analysts and platforms, like Santiment, have notified the community that price movements are being affected by the FOMO and FUD revolving around the market, indicating that this makes it difficult to predict price movements. BTC price movements can be properly predicated after a few days as the market behavior is indecisive currently.
Disclaimer: The views and opinions, as well as all the information shared in this price analysis, are published in good faith. Readers must do their own research and due diligence. Any action taken by the reader is strictly at their own risk, Coin Edition and its affiliates will not be held liable for any direct or indirect damage or loss.
Disclaimer: The information presented in this article is for informational and educational purposes only. The article does not constitute financial advice or advice of any kind. Coin Edition is not responsible for any losses incurred as a result of the utilization of content, products, or services mentioned. Readers are advised to exercise caution before taking any action related to the company.
 Price Prediction 2026, 2027, 2028, 2029, 2030-2050")
 Price Prediction 2026, 2027, 2028, 2029, 2030-2050")


