


- Bitcoin price analysis shows the bearish momentum is weakening in the last 2 hours.
- Strong support has formed around the $16,500 level and Bitcoin appears to be having trouble breaking it.
- The major crypto is still in a bearish trend overall, but if bears do not take control soon, we may see a shift to neutral shortly.
Recent Bitcoin price analysis reveals a low volatile market where the coin price is consolidating around $16,574.85. After experiencing a prolonged drop from its weekly high at $18,001 to a low of $15,898, Bitcoin has been on a slow but steady bearish sentiment in the last few hours and is currently trading at $16,574.85 (0.88% in the last 24 hours).
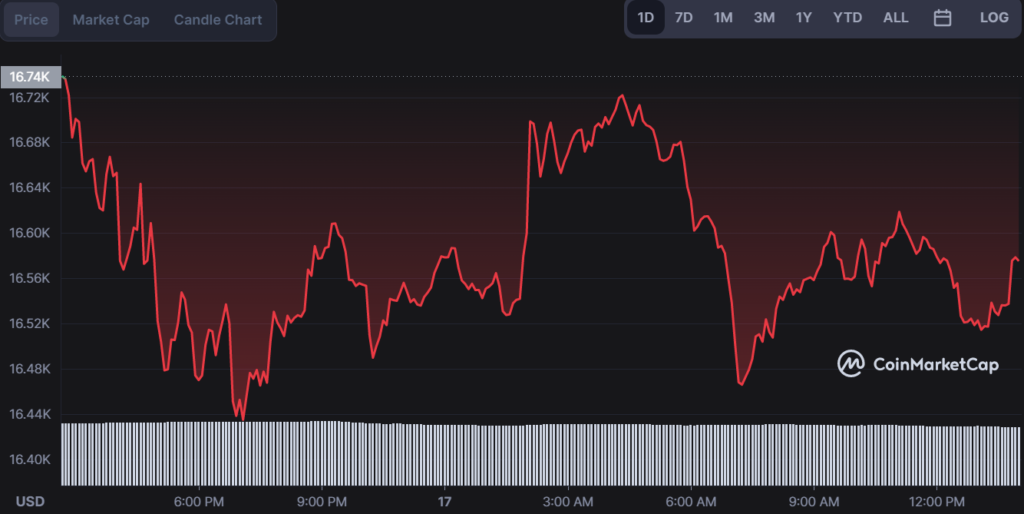
While Bitcoin continues to trade below $16,750 since late yesterday evening, bears have not managed to take advantage of this and any momentum they may have had is weakening in the last few hours. The lowest level hit during this time was around $15,985 and support lying close to the current price at $16,534 appears to be holding strong.
However true market sentiment will only be confirmed once BTC can decisively break through the strong support around $16,500 and start trading in the opposite direction for a period of time. Currently, the bearish scenario remains a viable one because Bitcoin is still exhibiting signs that it could head deeper into negative territory in the next few days if bulls do not gain enough strength again soon.
Bitcoin technical analysis indicates a bullish crossover on the 4-hour chart which is a possible indicator that BTC may not sell off any further and could even retrace some of its losses.
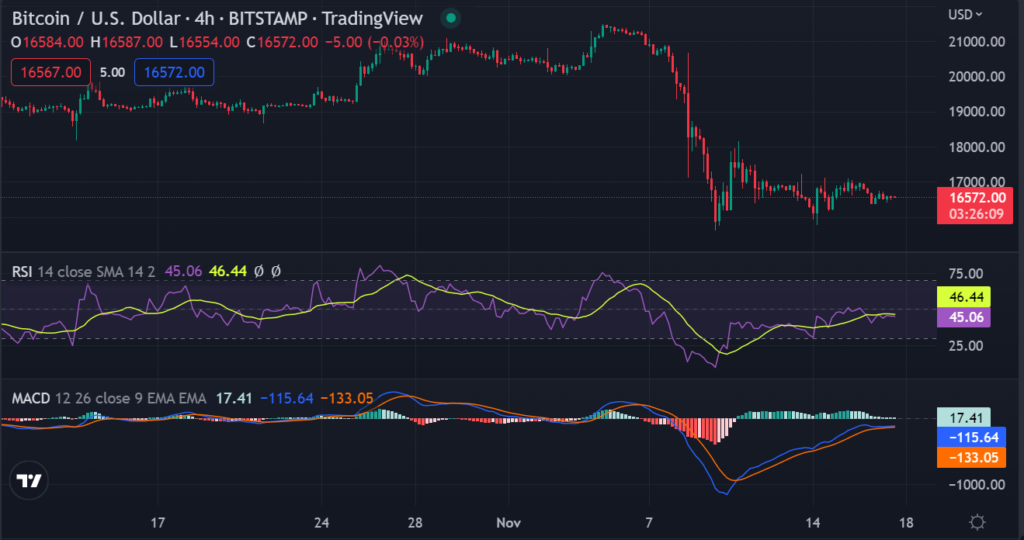
In addition, RSI levels show a decrease in Bitcoin’s selling momentum on the 1-hour chart which suggests that bulls may begin to take control again in the coming hours.
The moving average lines are still moving in tandem and show no signs of a possible bullish divergence. The EMA 10 is still below the EMA 20 and the MACD line for both of these indicators is heading downwards.
With Bitcoin being highly unpredictable and volatile, it remains to be seen how BTC will perform in the next few hours. If the price continues to trade around $16,600 – $16,700 without breaking through either side, then a reversal could occur soon and Bitcoin may start trading higher again. Only once Bitcoin is trading back above $16,750 for an extended period of time it would be considered a neutral market again.
However, if the current slow bearish trend continues over the next few hours and BTC breaks down through support at $15,985, all of the technical indicators will be pointing towards a deeper drop in price.
Disclaimer: The views and opinions, as well as all the information shared in this price analysis, are published in good faith. Readers must do their own research and due diligence. Any action taken by the reader is strictly at their own risk. Coin Edition and its affiliates will not be held liable for any direct or indirect damage or loss.
Disclaimer: The information presented in this article is for informational and educational purposes only. The article does not constitute financial advice or advice of any kind. Coin Edition is not responsible for any losses incurred as a result of the utilization of content, products, or services mentioned. Readers are advised to exercise caution before taking any action related to the company.
 Price Prediction: Can BTW Sustain Its Breakout Above $0.1032?")


