


- Analyst Michael van de Poppe tweeted today that BTC will look to bounce between $26.5k and $27k.
- The trader added that the potential rebound could result in BTC’s price recovering to $29.2k.
- At press time, the price of BTC stands at around $27,291 after a 1.21% 24-hour drop.
The renowned crypto trader Michael van de Poppe (@CryptoMichNL) tweeted his latest analysis for Bitcoin (BTC) this morning. In his tweet, van de Poppe shared that there will be a “bounce play” for BTC soon given that BTC was recently rejected by a key resistance level while funding rates for the crypto have become negative.
The trader added in the tweet that he is expecting the creation of bullish divergences between $26,500 and $27,000 before a recovery to $29,200. According to van de Poppe, traders will continue to dump their BTC holdings today before the recovery as well.
At press time, BTC’s price dropped 1.21% over the last 24 hours according to CoinMarketCap. Furthermore, the market leader’s price is down just over 8% over the last 7 days. As a result, BTC is currently trading at around $27,291.
BTC’s 13.14% increase in daily trading volume seems to have been mainly sell volume as the crypto’s price has retraced from its daily high of $27,978.98 to its current level. The leading crypto was still, however, able to outperform its biggest competitor, Ethereum (ETH).
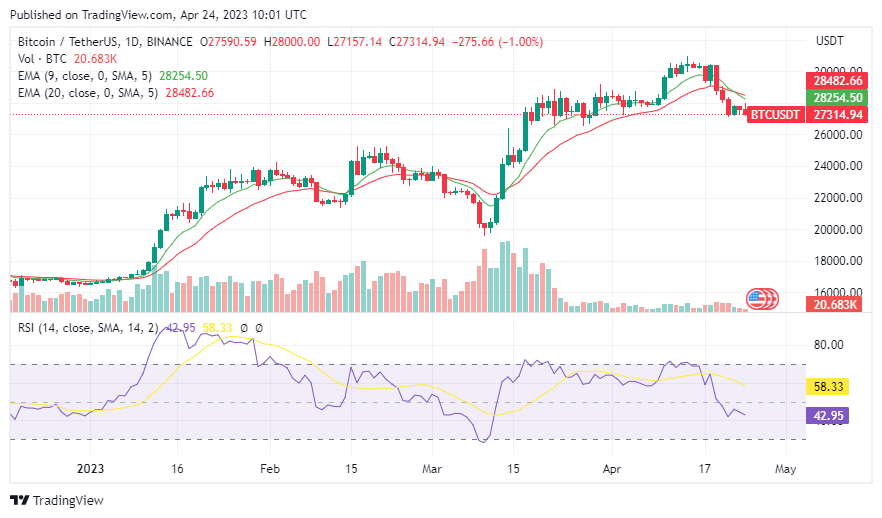
A notable bearish technical flag was triggered on BTC’s daily chart recently with the 9-day EMA crossing below the 20-day EMA in the last 48 hours. This bearish flag suggests that BTC’s price has entered into a short-term bearish cycle and will continue to drop in the next 24-48 hours.
Should this bearish flag be validated, BTC’s price may look to drop to the next key support level at around $25,075 in the coming few days. The daily RSI indicator supports this bearish thesis as the RSI line is currently sloped negatively toward the oversold territory and is trading below the daily RSI SMA line.
Disclaimer: The views and opinions, as well as all the information shared in this price analysis, are published in good faith. Readers must do their own research and due diligence. Any action taken by the reader is strictly at their own risk. Coin Edition and its affiliates will not be held liable for any direct or indirect damage or loss.
Disclaimer: The information presented in this article is for informational and educational purposes only. The article does not constitute financial advice or advice of any kind. Coin Edition is not responsible for any losses incurred as a result of the utilization of content, products, or services mentioned. Readers are advised to exercise caution before taking any action related to the company.


