


- According to recent pricing analyses, the Bitcoin market is on the rise.
- Technical indications warn traders to exercise care in the near term.
- During the ascent, BTC prices will face opposition at $17,216.83.
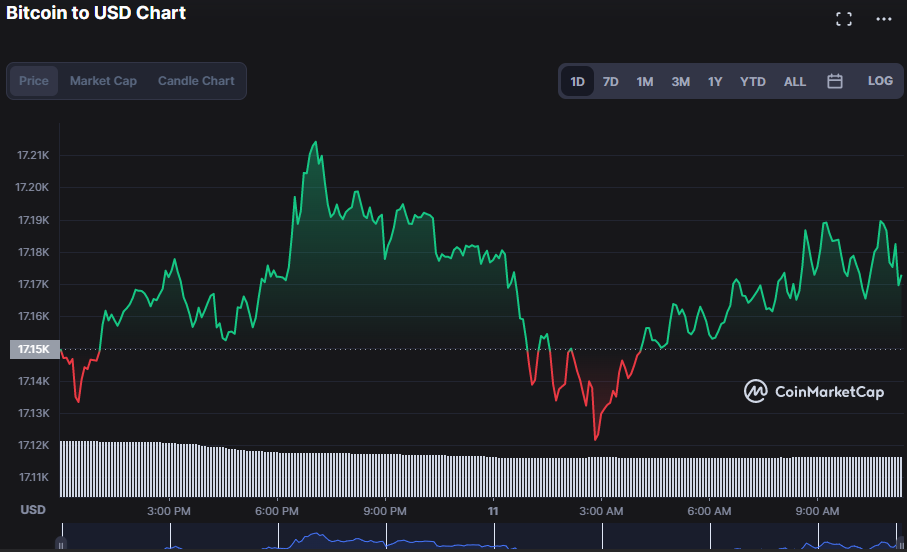
At the start of the day, the Bitcoin (BTC) market was dominated by bears, with prices plummeting to a low of $17133.37. Bulls, on the other hand, came in to reject this unfavorable trend, raising the price by 0.18% to $17,178.20. Throughout the day, this bullish trend established support around $17,120.68 before encountering resistance at the intraday high of $17,216.83.
During the upturn, the market capitalization jumped by 0.19% to $330,307,633,679, but the trading volume dipped by 28.30% to $12,870,201,575 reflecting that buyers are not matching sellers’ expectations.
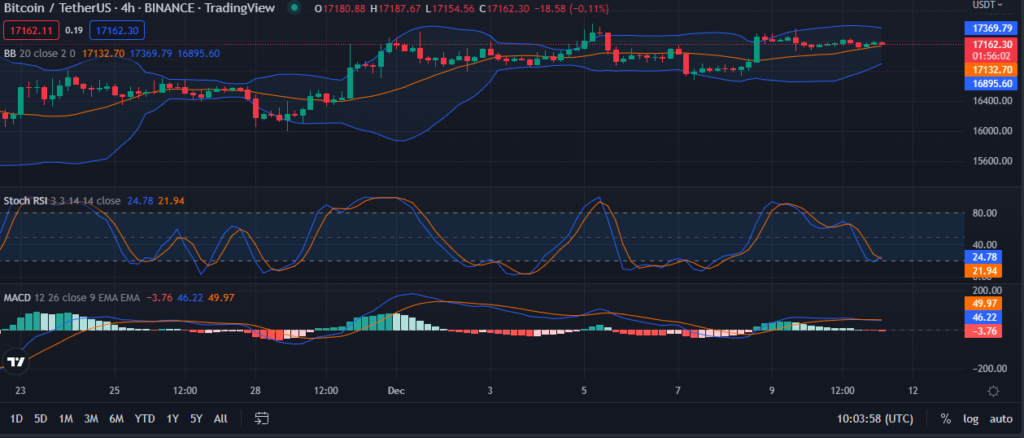
The narrowing Bollinger bands are a concern for this bullish trend, with the upper band touching $1737.31 and the lower band at 16895.68. However, as the price oscillates towards the upper band, this positive trend is supported, implying additional bullish development.
With a value of 25.24, the stochastic RSI suggests that this bullish trend has yet to reach its zenith, as it points higher, indicating that this bull strength is strengthening, implying that a further bull run is on the horizon.
In addition, the MACD blue line’s downward trend below the signal line at 46.86 is causing investors some concern. Moreover, traders should be wary in the foreseeable future because the histogram is trending downward.
To maintain this steady growth, bulls must retain the resistance level and force prices higher.
Disclaimer: The views and opinions, as well as all the information shared in this price analysis, are published in good faith. Readers must do their own research and due diligence. Any action taken by the reader is strictly at their own risk, Coin Edition and its affiliates will not be held liable for any direct or indirect damage or loss.
Disclaimer: The information presented in this article is for informational and educational purposes only. The article does not constitute financial advice or advice of any kind. Coin Edition is not responsible for any losses incurred as a result of the utilization of content, products, or services mentioned. Readers are advised to exercise caution before taking any action related to the company.


