


- Despite resistance at $4.30, CAKE remains under a bullish grip.
- Indicators suggest that bear dominance is on the horizon.
- According to CMF, traders are cashing out their gains.
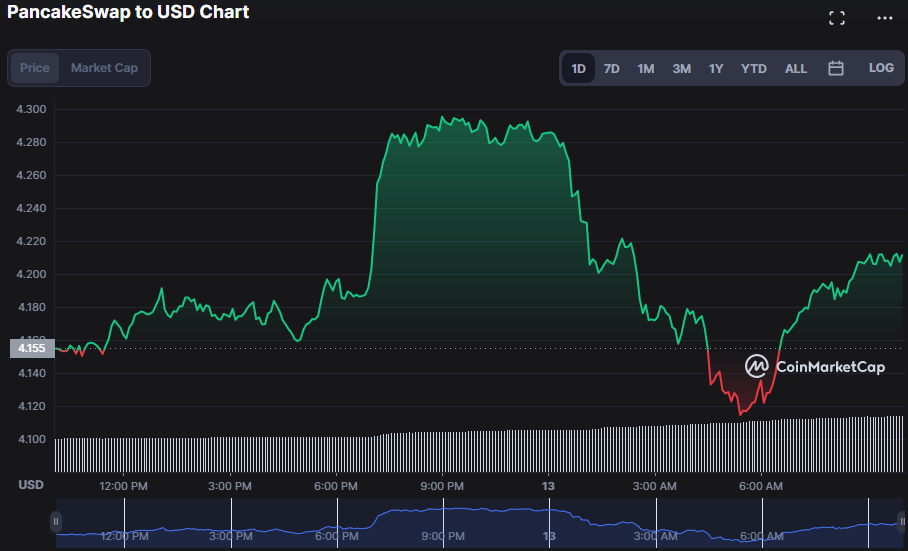
Bearish efforts to capture market share for PancakeSwap (CAKE) found support at $4.11 in the previous 24 hours. Nevertheless, CAKE’s price rose to a day’s high of $4.30 on the back of the bullish control and is presently trading at $4.22, a gain of 1.51%.
Fear of bear capture caused the market capitalization to decline by 0.59% to $701,982,961. However, the market has remained optimistic, with traders looking to capitalize on the decline, as seen by a 69.41% increase in 24-hour trading volume, which now stands at $51,768,764. Due to the low entry price, this positive trend may continue, prompting investors to purchase the dip to take advantage of a good chance.
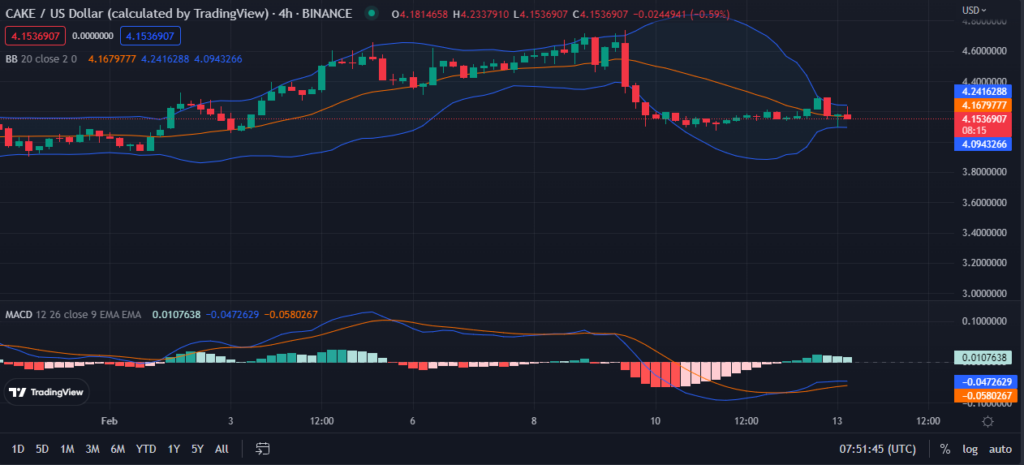
With a score of 4.2505513 for the upper Bollinger band and a score of 4.0933748 for the lower band, the 4-hour price chart for CAKE indicates a sideways trend. However, price movement towards the top range suggests that buyers may be gaining strength for an emerging bullish trend.
As the bulls continue pushing for higher prices, purchasing pressure is rising, supported by the number of transactions. This surge means that the market is busier and more volatile than before, which indicates buyers are becoming more confident.
The moving average convergence/divergence (MACD) line is trending above the signal line at -0.0424591, suggesting that the bullish mood is gaining strength and that prices may rise higher in the future. Higher prices, increasing volume, and a strong MACD reading indicate that the market will likely start a bullish trend.
This move implies that the bulls exert significant purchasing pressure and that market participants’ mindset has turned toward a more bullish view. Furthermore, the histogram’s optimistic reading of 0.011444 corroborates the expanding divergence between the MACD and the signal line, adding weight to the case for an optimistic outlook.
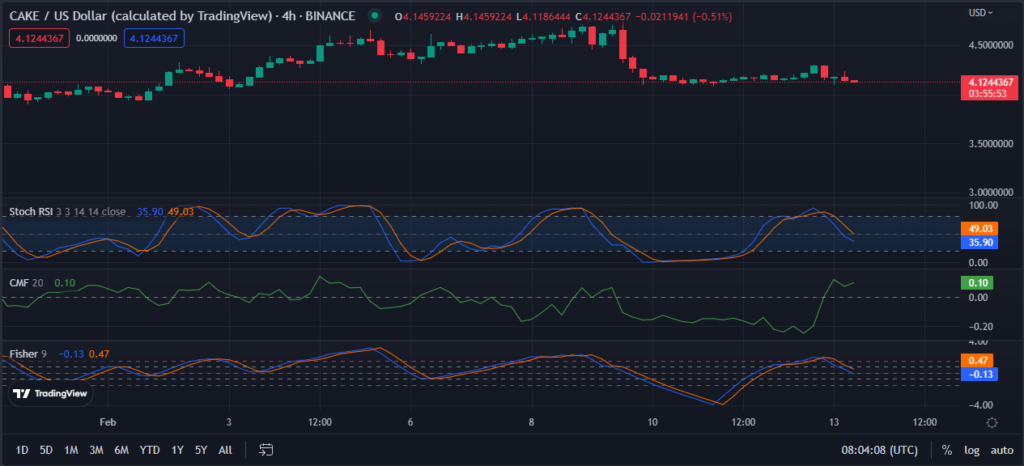
CAKE’s positive momentum may fade as the stochastic RSI drifts below its signal line at 44.66, suggesting a likely change in attitude shortly. This shift means shareholders are cashing in their gains and reducing their stock holdings.
There may be a lack of purchasing pressure and the beginning of a negative mood, as shown by the downward trend of the Chaikin Money Flow (CMF), which now stands at 0.07. This change in the CMF’s position lends credence to the stochastic RSI’s downward trend. It may signal a shift in investor sentiment for CAKE and its potentially dangerous trajectory soon.
A further sign that CAKE may see a bearish reversal in the short term is that the Fisher Transform has moved below its SMA line, with a value of 0.47. Although the market is generally bullish, this development indicates that the bullish trend is losing steam, and bears may seize control.
Indicators hint at a turnaround in the CAKE market, cautioning traders to trade with caution as the optimistic mood wanes.
Disclaimer: The views and opinions, as well as all the information shared in this price analysis, are published in good faith. Readers must do their own research and due diligence. Any action taken by the reader is strictly at their own risk, Coin Edition and its affiliates will not be held liable for any direct or indirect damage or loss.
Disclaimer: The information presented in this article is for informational and educational purposes only. The article does not constitute financial advice or advice of any kind. Coin Edition is not responsible for any losses incurred as a result of the utilization of content, products, or services mentioned. Readers are advised to exercise caution before taking any action related to the company.


