


 Momentum Signals Potential Buying Opportunity")
- SPACE ID’s bullish trend indicates potential for significant gains.
- Positive momentum and investor trust is driving ID’s success.
- Technical indicators signal substantial buying opportunities for traders.
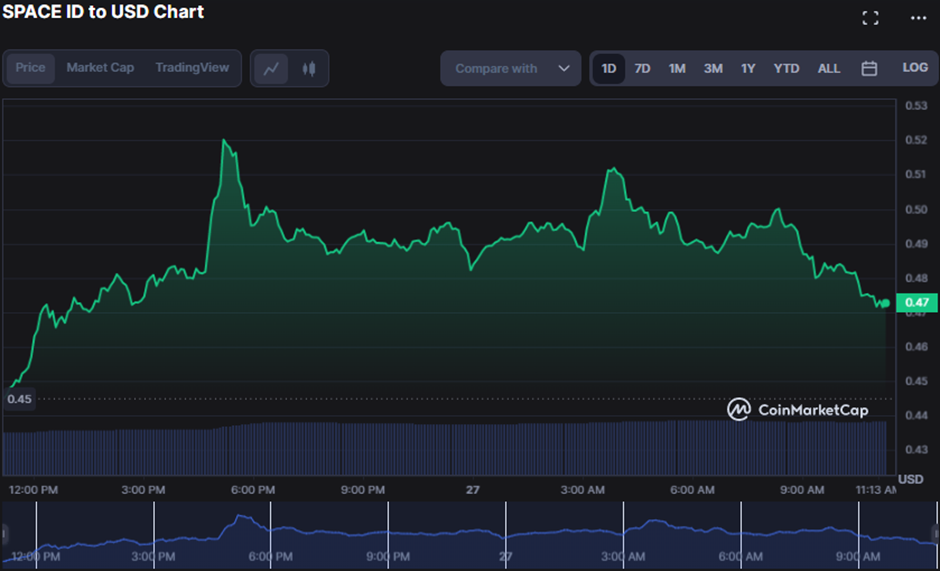
SPACE ID (ID) prices have moved between a 24-hour high and low of $0.5206 and $0.4631, indicating a bullish trend. At this writing, the bulls were still in the market, causing ID to trade at $0.4725, a 6.12% increase from the previous day’s closing price.
Continued positive momentum in the market may push prices beyond the $0.5206 barrier level, with further resistance at $0.5500 and $0.5800. On the other hand, a rapid change in market mood might trigger a negative reversal.
During the upturn, market capitalization, and 24-hour trading volume increased by 5.83% and 24.87%, respectively, to $135,402,469 and $237,426,907, indicating the market’s purchasing pressure. This spike illustrates investors’ rising trust in the market and indicates a bullish prognosis for ID’s future success.
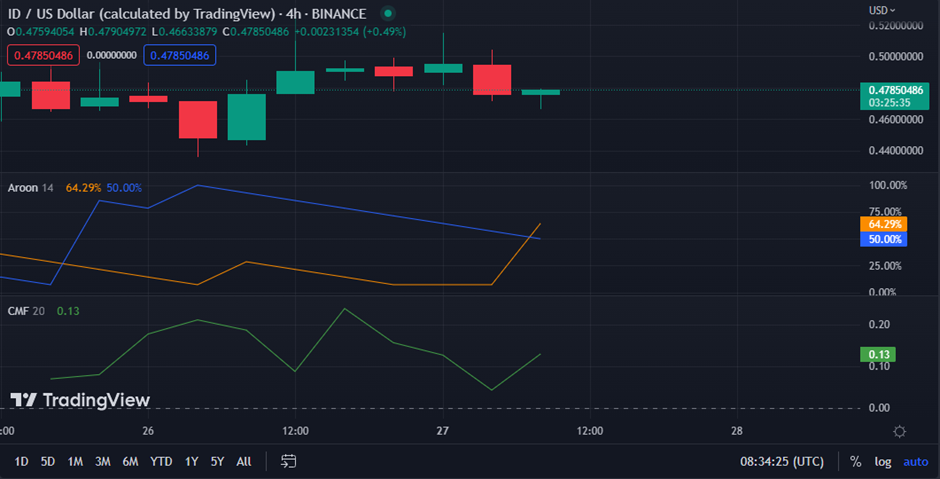
In the ID/USD 4-hour price chart, the Aroon up reading of 64.29% and the Aroon down the reading of 50.00% indicates that the present bullish momentum is strong and expected to continue in the near future. However, there may be some minor corrections or pullbacks along the way.
This action increases traders’ confidence in the upswing and may entice additional buyers to enter the market, propelling prices further.
With a score of 0.11, the Chaikin Money Flow move north indicates that money is pouring into the market, indicating a positive feeling among investors and the likely continuation of the upward trend.
This movement also enhances market trading volume and liquidity, making it more straightforward for traders to purchase and sell IDUSD at favorable prices.
With a value of 48.21, the stochastic RSI climbs above its signal line, indicating that the positive momentum in ID/USD will likely continue in the short term, signaling a potential buying opportunity for traders.
This expectation is because it evaluates the intensity and velocity of a trend, and when it crosses over its signal line, it indicates that purchasing pressure is building and might lead to more price advances.
The Money Flow Index advances north with a rating of 47.03, indicating a purchasing pressure in the market as more money flows into the stock, indicating a probable higher trend soon.
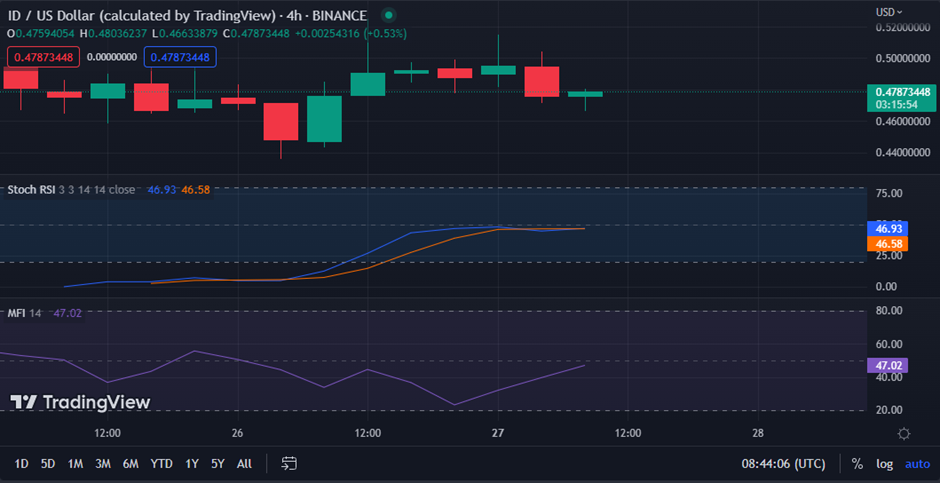
ID’s bullish trend continues as market cap, and trading volume show that traders are confident in the upswing and potential buying opportunities ahead.
Disclaimer: The views, opinions, and information shared in this price prediction are published in good faith. Readers must do their research and due diligence. Any action taken by the reader is strictly at their own risk. Coin Edition and its affiliates will not be liable for direct or indirect damage or loss.
Disclaimer: The information presented in this article is for informational and educational purposes only. The article does not constitute financial advice or advice of any kind. Coin Edition is not responsible for any losses incurred as a result of the utilization of content, products, or services mentioned. Readers are advised to exercise caution before taking any action related to the company.


